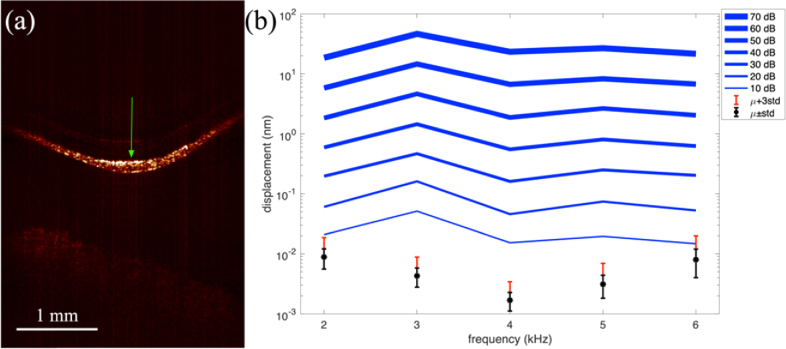
Fig. 4.
(a) Cross-sectional image of the tympanic membrane. Green arrow indicates where the vibratory response was recorded. (b) Tuning curves over the 2-6 kHz, 10-70 dB SPL range. The * is the noise mean (µ) with error bars at ± standard deviation (std). The red error bar is µ+3std, i.e. the sensitivity to vibration. Any signals below this level are generally disregarded as too weak to consider.

