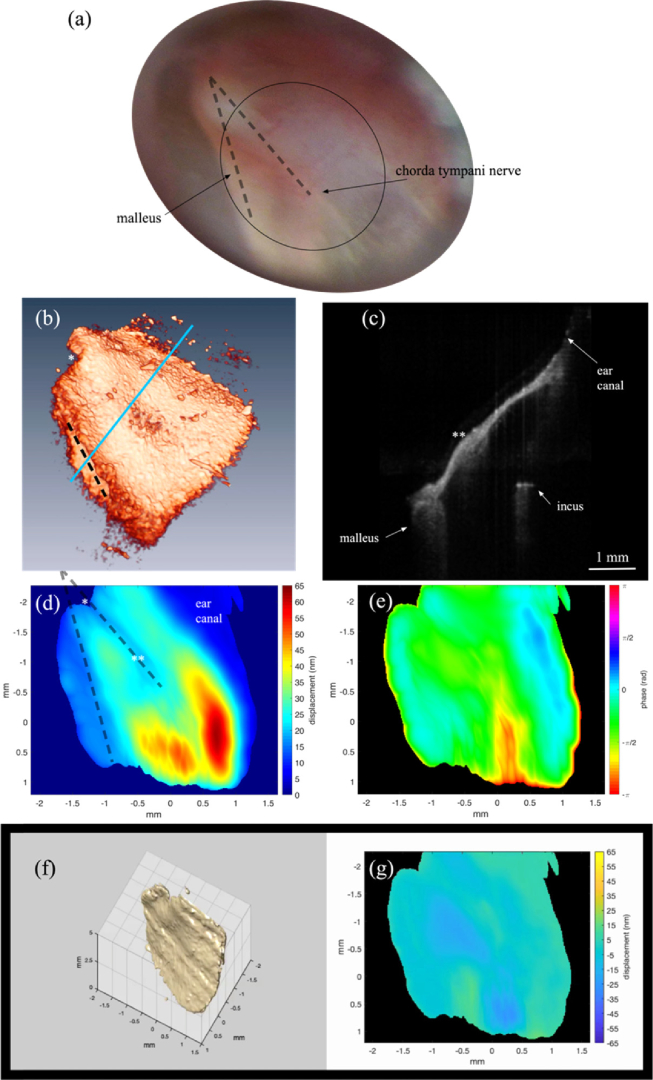
Fig. 5.
All images collected in vivo on the left ear of a healthy patient. (a) Photograph taken through the surgical microscope. The malleus and chorda tympani nerve are labeled and marked with dashed lines. The approximate field of view of the OCT images is indicated by the ellipse. (b) First frame from a movie (Visualization 1 (7.4MB, mp4) ) of the OCT volume image recorded just prior to the vibrational measurements. The black dashed line indicates the relative position of the malleus. A yellow line in the visualization labels the chorda tympani nerve. The * and ** in (b), (c), and (d), mark corresponding points in the respective images. (c) Cross-sectional image from the volume showing the malleus, incus and wall of the ear canal (d) Vibrational amplitude map at the stimulus frequency (3.3 kHz) following 50 ms 65 dB SPL stimulus. (d) Dashed lines label the malleus and chorda tympani nerve as in (a). (e) Corresponding phase. (f,g) First frame of a movie (Visualization 2 (6.5MB, mp4) ) showing a volume rendering of the TM vibration in (e) and the corresponding time dependent amplitude map in (f). The vibration was scaled by a factor of 6600 in (e) so that the vibrational pattern would be visible in the image.

