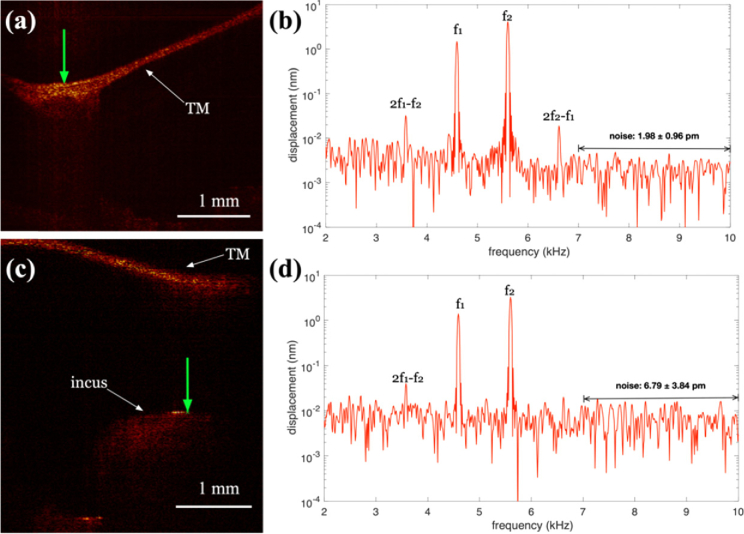
Fig. 6.
(a) Cross-sectional OCT images of the tympanic membrane (TM) at the umbo region of the malleus (a) and long process of the incus (c). The green arrow indicates where the displacement was measured in b) and d). b,d) Displacement (log10 scale) vs. frequency. The stimulus was 65 dB SPL pure tones at f1=4.59 kHz and f2=5.60 kHz. The stimulus duration was 50 ms with 400 trials. The average response is plotted. Noise floor was calculated in the 7-10 kHz range.

