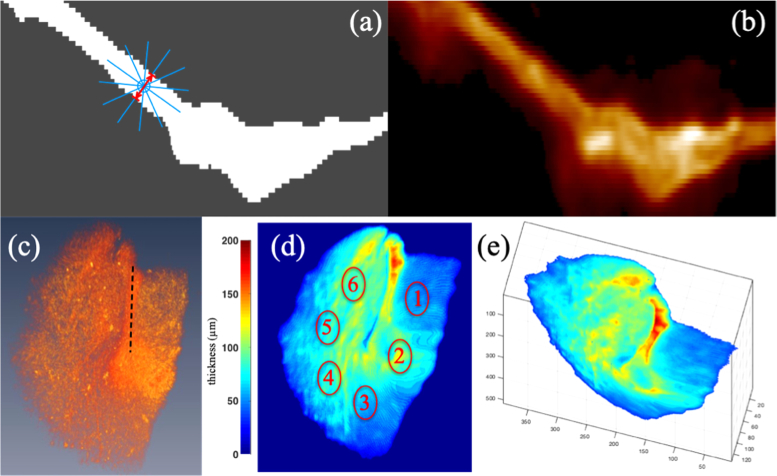
Fig. 8.
(a) Cartoon illustrating algorithm for finding TM thickness. (b) OCT cross-sectional image used to create the binary mask in (a). (c) Snapshot from a volume rendering of the OCT data oriented to match the orientation of the thickness map in (d). The black dashed line highlights the malleus. This placement is obvious from viewing the associated movie (Visualization 4 (3.6MB, mpg) ). (d) Thickness map projected on the x,y plane. The thickness at the six labeled regions of interest are provided in table 1. (e) The true 3-D thickness map, rotated out of the x,y plane. See associated movie for various viewing angles (Visualization 5 (3.5MB, mp4) ).

