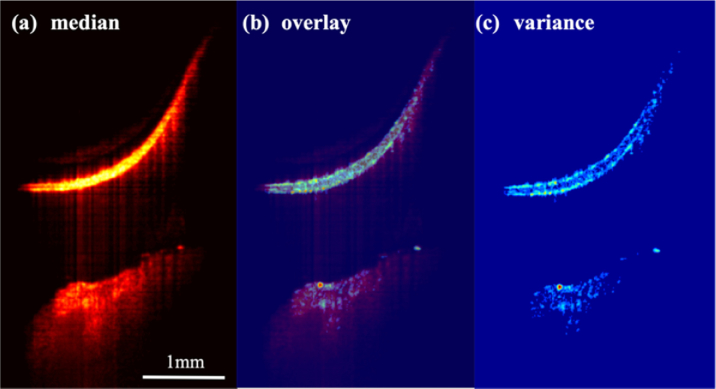
Fig. 9.
(a) Median amplitude image generated from 495 sequentially acquired B-scans. The tympanic membrane is the bright structure at the top of the image. The cochlear promontory along with what appears to be the inner wall of the cochlea are at the bottom of the image. The scale bar is 1 mm. (c) Phase image highlighting the vasculature of the middle ear. (b) Overlay of the variance and median images showing how the large variance on the tympanic membrane aligns with the cutaneous (top) and mucosal (bottom) layers of the membrane. The variance is much lower in the central fibrous layer.

