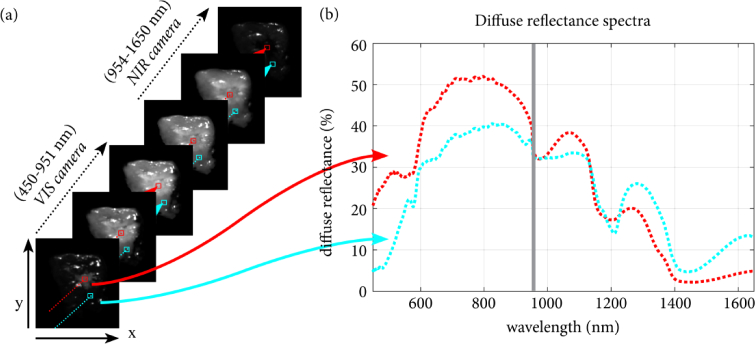
Fig. 1.
Hyperspectral data. a) The tissue was imaged with both the VIS and NIR camera. Thereby, two 3D hypercubes were created that contain both spectral and spatial information of the imaged scene. Therefore, each vector in the 3D HS image contains an entire spectrum over a broad wavelength range, as shown in (b). The red and cyan diffuse reflectance spectra shown in (b) correspond to the red and cyan selected pixels in (a). In this example, the VIS image was resized to match the resolution of the NIR image, as described in Section 2.4.

