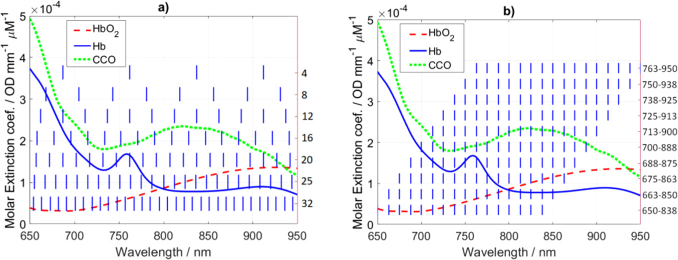
Fig. 1.
Specific extinction coefficients of oxy- (HbO2), deoxyhemoglobin (Hb) and cytochrome-c-oxidase (CCO) [1]. The vertical blue lines show the choices of wavelengths for the analysis of the standard deviations in the estimation of changes in chromophores concentrations for different number of wavelengths (a) and 16 consecutive wavelengths separated by 12.5 nm (b).

