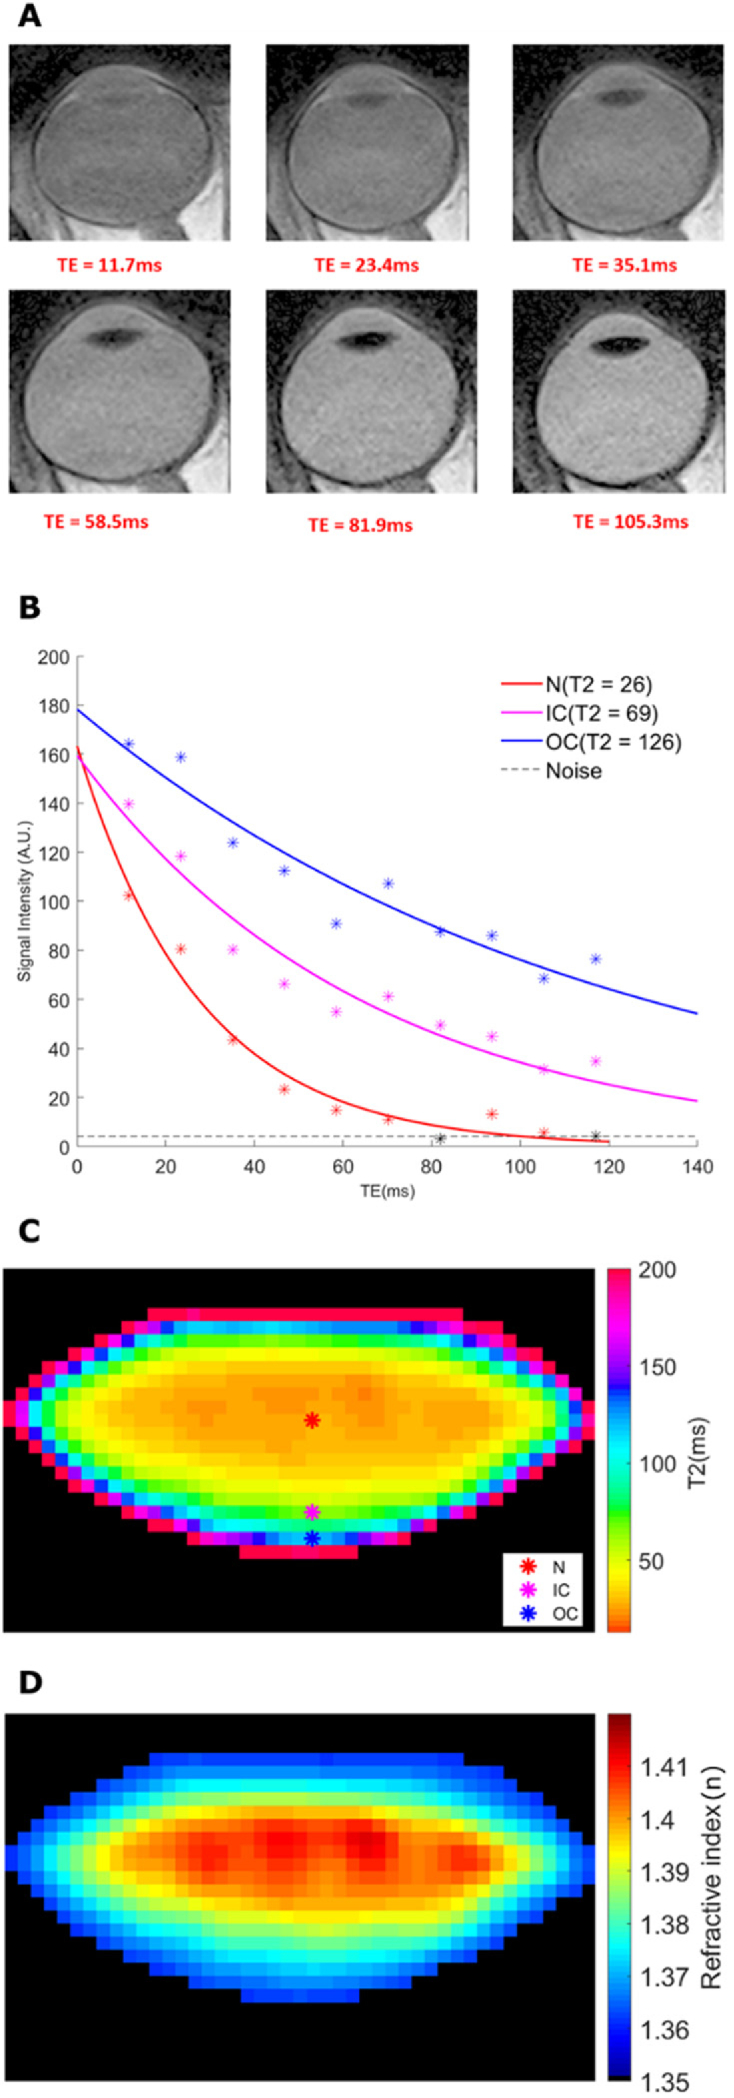
Fig. 3.

T2 imaging of the lens to extract the GRIN. (A) A sequence of 6 representative MSE images obtained using different TEs. Six representative nominal TE selected from the all images were presented here. (B) Three pixels were labelled to represent three lens regions (nucleus, inner cortex and outer cortex), and their exponential curves were displayed. The lens tissue from these three regions have different relaxation behaviour and thus, different T2 values. (C) Raw T2 images are then processed to generate T2 maps of the lens. Coloured markers on the lens mark the same regions used for curve fitting process in panel (B). (D) T2 values were converted to refractive index values (n) to produce a GRIN map.
