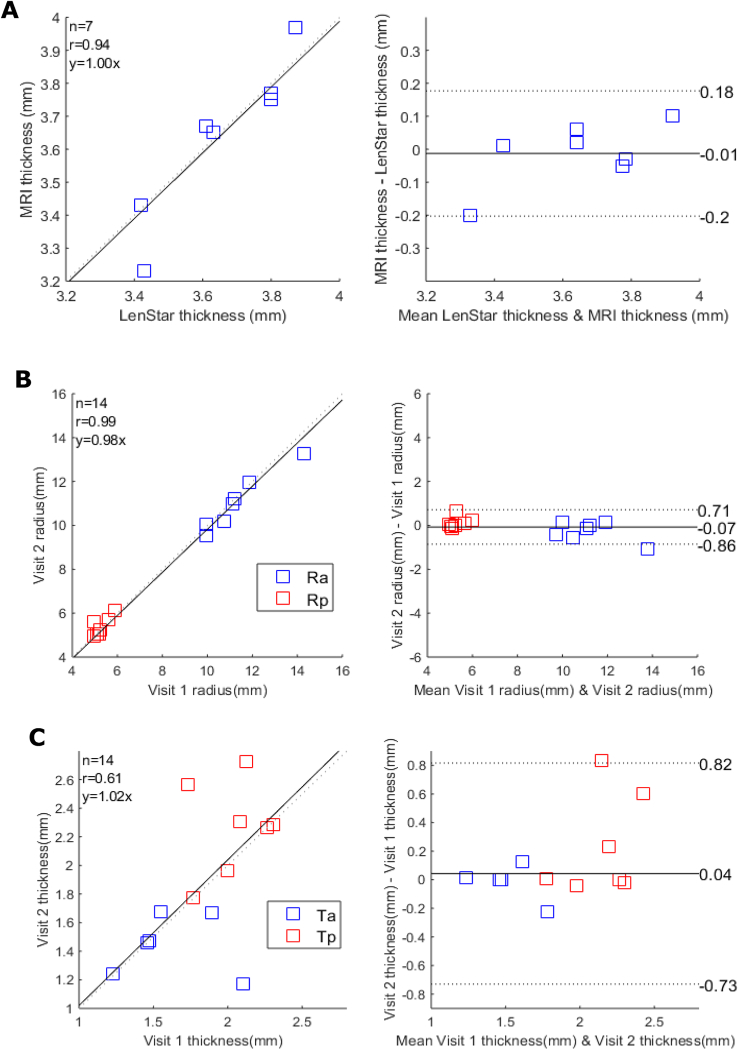
Fig. 5.
Accuracy and repeatability of measurements of lens geometry. (A) Correlation plot (left panel) comparing the measurements of lens thicknesses obtained from MRI and LenStar, and the two methods were assessed by Bland & Altman equity plot right panel confirming that the two techniques gave measures of lens thickness that lay within the 95% confidence limits (dashed lines). (B&C) Correlation plots (left panels) comparing the measurements lens radius (B: Ra blue; Rp red) and thickness (C: Ta blue; Tp red) taken at the first and second visit for each participant and the associated Bland & Altman equity plots (right panels).

