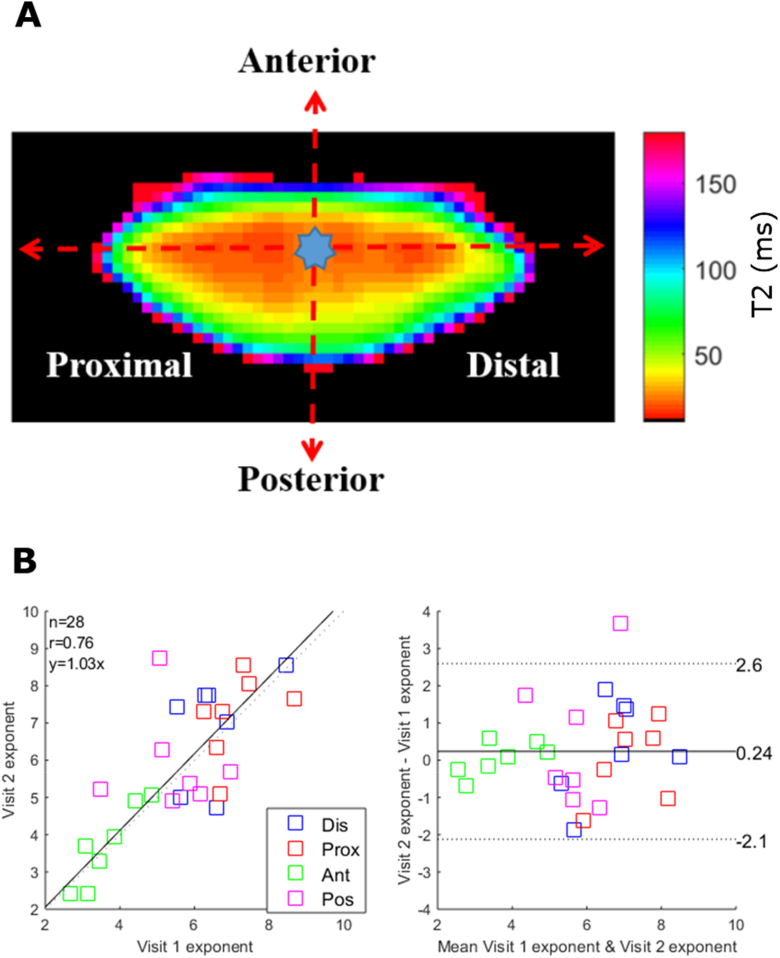
Fig. 6.
Trend analysis and repeatability of T2 measurements. (A) T2 map showing the optical centre from which line plots were extracted along the anterior, posterior, proximal and distal axes. (B) The extracted line plots along each axis were fitted with Eq. (4) and the exponents c from the first and second visit were displayed on a correlation (left panel) and Bland-Altman equity (right panel) plots to assess inter-day repeatability. In the correlation plot, the black line shows the unity line. The 95% limit of agreement is indicated as two dash lines.

