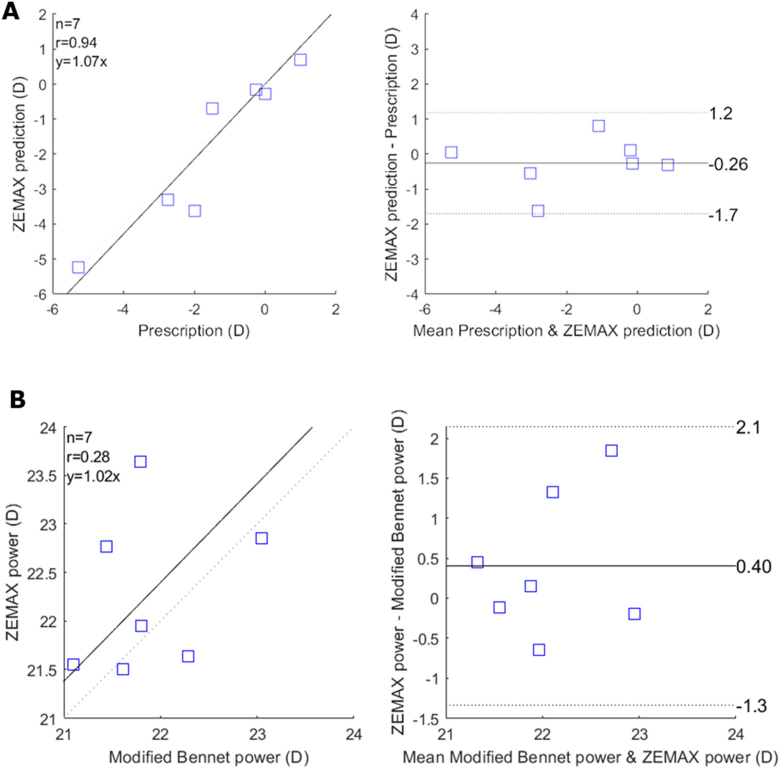
Fig. 8.
ZEMAX modelling of the eye accurately predicts the refractive error. (A) Correlation plot (left panel), and Bland & Altman analysis (right panel) show that the ZEMAX model can predict the spherical equivalent error measured clinically for each participant. (B) Correlation plot and Bland (left panel) & Altman analysis (right panel) show that our methods can estimate lens power with comparable results with the lens power obtained from the modified Bennet method. The black line indicates the equity plot and the dashed lines indicate the 95% limit of agreements.

