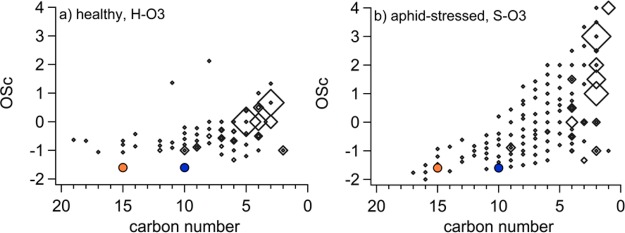
Figure 5.
Ozonolysis oxidation products measured in the chamber during the last 30 min of the experiment plotted on a 2-D axis of oxidation state (OSc) and carbon number for the (a) healthy plant emissions and (b) aphid-stressed emissions. Each diamond marker denotes one peak identified in the acetate-CIMS, and the size of the marker indicates intensity of the signal. Filled circles indicate the location of dominant SOA precursor species in the ozonolysis experiments with (solid orange circles) for sesquiterpenes and (solid blue circles) for monoterpenes.

