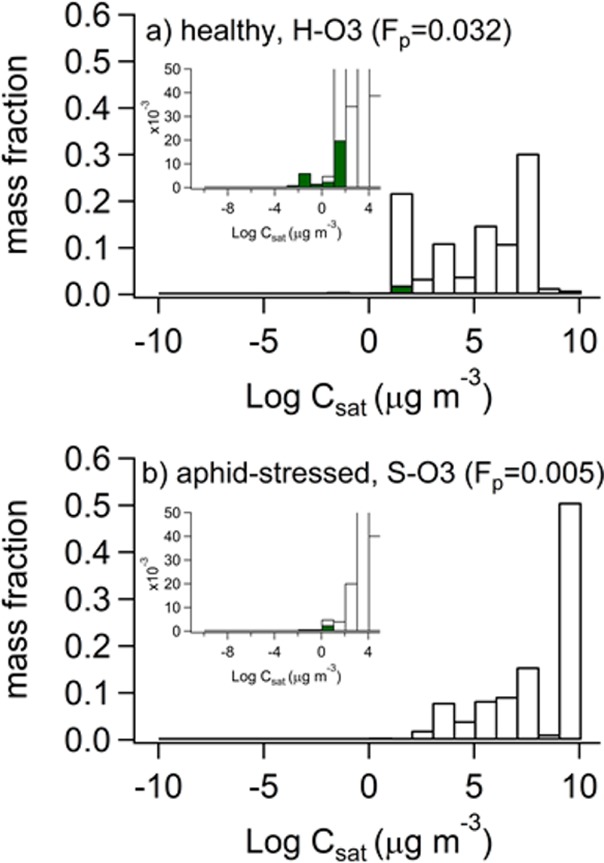
Figure 7.

Volatility distributions of the ozonolysis oxidation products measured with acetate-CIMS for the (a) healthy plant emissions and (b) aphid-stressed emissions. Shaded areas indicate the fraction of the measured gas-phase that would be expected to exist in the particles for a background organic aerosol mass loading of 1 μg m–3.
