Figure 3.
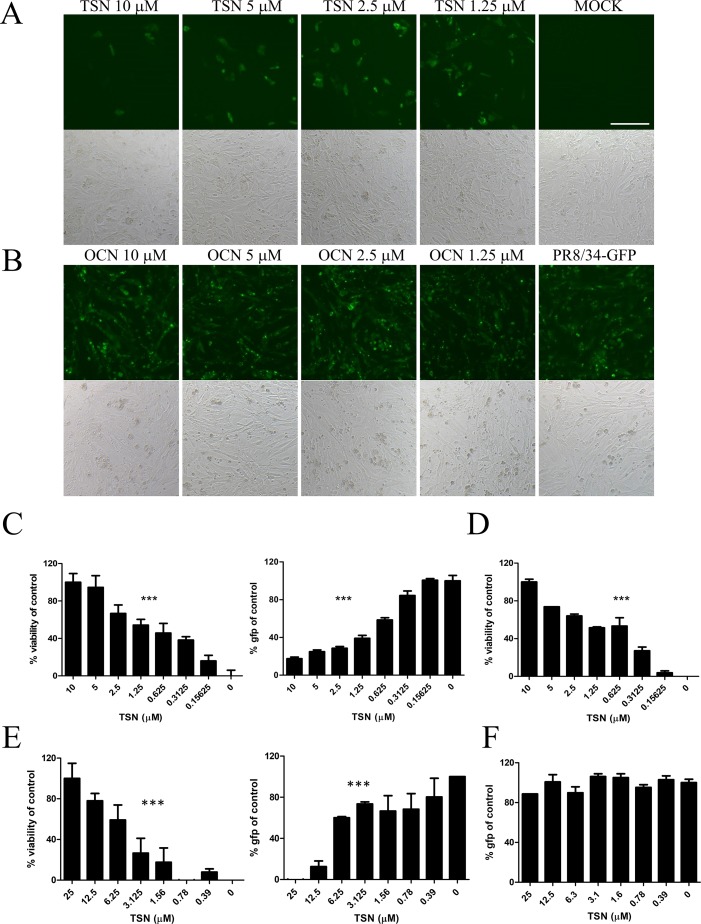
TSN suppressed influenza A virus infection in a dose-dependent manner. (A and B) In the pretreatment assay, MDCK cells were pretreated with various concentrations of TSN (A) or OCN (B) for 6 h prior to 10 MOI A/PR/8/34-GFP virus infection. The expression of viral GFP protein was detected by fluorescence microscopy (upper panel, fluorescence; bottom panel, phase contrast) at 24 h postinfection (hpi). Scale bars, 100 µm at ×20 magnification. (C) Measurement of the cytopathic effect (CPE) induced by 10 MOI A/PR/8/34-GFP virus in MDCKs cells pretreated with TSN using the MTS assay (left panel, IC50 = 0.76 microM) (non-virus-infected cell, 100% viability), and the expression of viral GFP was detected by fluorescence spectrometry (right panel, IC50 = 0.55 microM) at 24 hpi (GFP-virus-infected cell, 100% GFP value). (D) H3N2 (10 MOI) virus-induced CPE in TSN-pretreated MDCK cells was measured by MTS assay at 24 hpi. (IC50 = 0.48 microM) (E) In the cotreatment assay, MDCK cells were treated with a mixture of 10 MOI A/PR/8/34-GFP virus and TSN. CPE was measured by MTS assay (left panel, IC50 = 5.09 microM) and the expression of viral GFP protein by fluorescence spectrometry (right panel, IC50 = 3.34 mM) at 24 hpi. (F) In the posttreatment assay, MDCK cells were treated with TSN after 10 MOI A/PR/8/34-GFP infection, and CPE was measured by MTS assay at 24 hpi. The data are presented as mean ± SD of three replicates. All data are representative of three independent experiments. The statistical significance was analyzed by one-way ANOVA. ***P < 0.001.

