Figure 6.
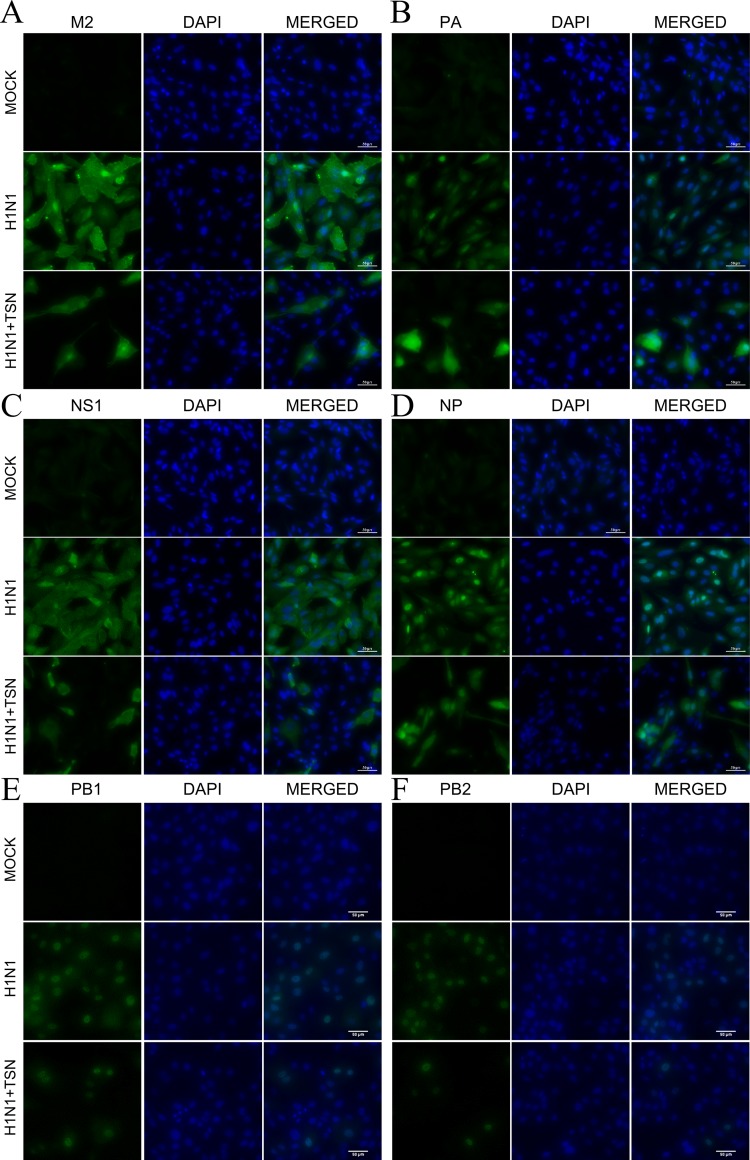
TSN pretreatment reduced viral M2, PA, NS1, NP, PB1, and PB2 protein expression levels and altered PA protein subcellular localization. MDCK cells were pretreated with TSN (2 µM) and then infected with 10 MOI A/PR/8/34. Cells were immunostained at 18 hpi. Green foci indicated the presence of M2 (A), PA (B), NS1 (C), NP (D), PB1 (E), or PB2 (F) viral proteins (left column). The nucleus was counterstained with DAPI (blue, middle column). Merged images indicate the subcellular localizations of immunostained proteins (right column). Data are representative of three different experiments. H1N1, control virus-infected MDCK cells. Scale bars, 50 µm at ×40 magnification.

