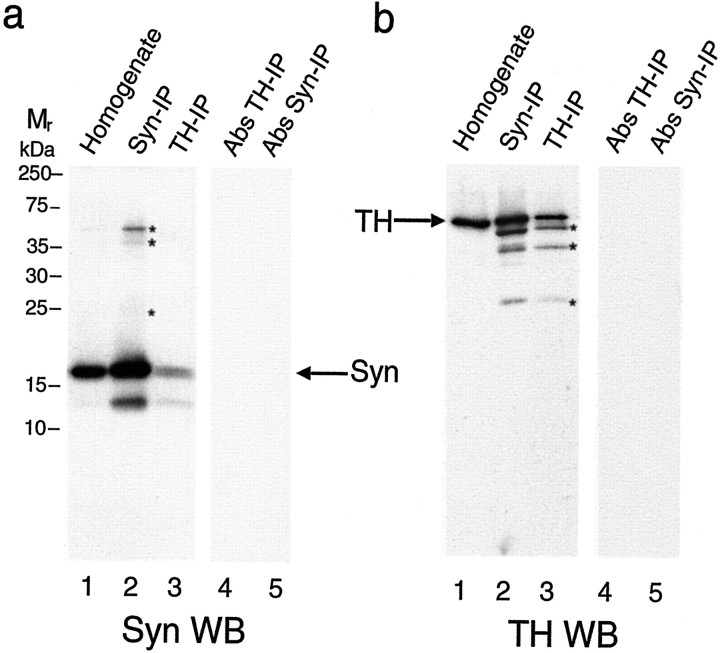
Fig. 1.
Interaction of α-synuclein with TH in rat brain. Data from a representative experiment showing Western blots (WB) reacted with the α-synuclein antibody (a) or with the TH antibody (b). a, WB of α-synuclein from rat striatum shows α-synuclein in the initial homogenate (lane 1), the α-synuclein IP (Syn-IP) sample (lane 2), the TH-IP sample (lane 3), a control IP using preabsorbed TH antibody (Abs TH-IP, lane 4), and control IP using preabsorbed α-synuclein antibody (Abs Syn-IP,lane 5). In b the WB reacted with the TH antibody shows TH in the initial homogenate (lane 1), the α-synuclein IP sample (lane 2), the TH IP sample (lane 3), a control IP using preabsorbed TH antibody (lane 4), and control IP using preabsorbed α-synuclein antibody (lane 5). Nonspecific bands, two of which appear to be IgG bands, are evident in lanes with stronger chemiluminescence signal (indicated by asterisks ina and b). Molecular weights in kilodaltons (kDa), determined from prestained standards, are indicated on the left.

