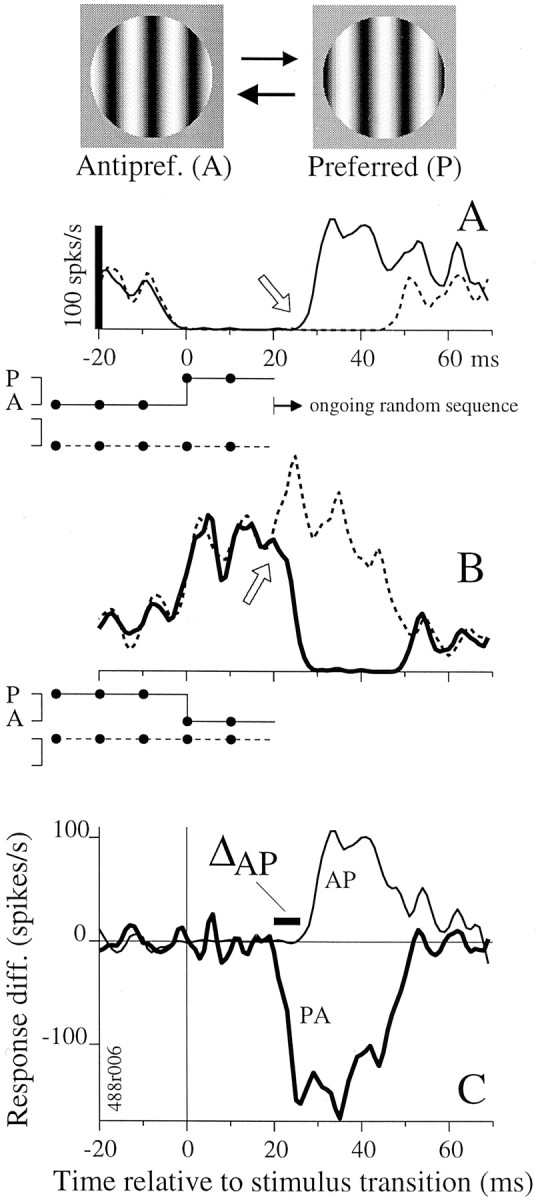
Fig. 1.

The estimation and comparison of response timing for turning on and turning off are demonstrated for an LGN p-cell.Top, Stimulus icons show preferred and antipreferred stimuli, P and A, one of which was chosen randomly for presentation every 10 msec. A, Average firing rate versus time is plotted for two 50 msec stimulus sequences, which are depicted below the abscissa. Solid lines indicate the stimulus and response for a transition from A to P (i.e., a change from the left to right stimulus icon, top), whereas dashed lines indicate the reference stimulus, 50 msec of A, and its response. Time 0 is when the transition to P occurred. Response latency was ∼30 msec; therefore, the first and last 20 msec of the response traces are averages of responses to a random set of sequences that occurred before and after the 50 msec trigger sequences (seearrow and label ongoing random sequence) and should not be confused with spontaneous firing rate. Epochs of A were associated with near zero firing rate, and the onset of P caused a rapid rate increase (solid response curve). Response curves were based on 253 occurrences of the stimulus sequences (see Materials and Methods). B, Responses of the same cell to the PA transition (a change from the right to left stimulus icon,top) are shown in the format of A. Firing rate was high for P epochs and dropped rapidly after the transition to A. Response curves were based on 253 occurrences of the stimulus sequences. C, The difference between the response to the AP transition and to its reference stimulus (in A, solid minus dotted line) is plotted here as the thin line. The analogous difference between the traces in B is plotted as the thick line. These response difference traces allow direct comparison of the timing of the onset of signals evoked by the AP and PA stimulus transitions. We defined ΔAP to be the difference in timing between the onsets of the AP and PA response (thick bar; see Materials and Methods).
