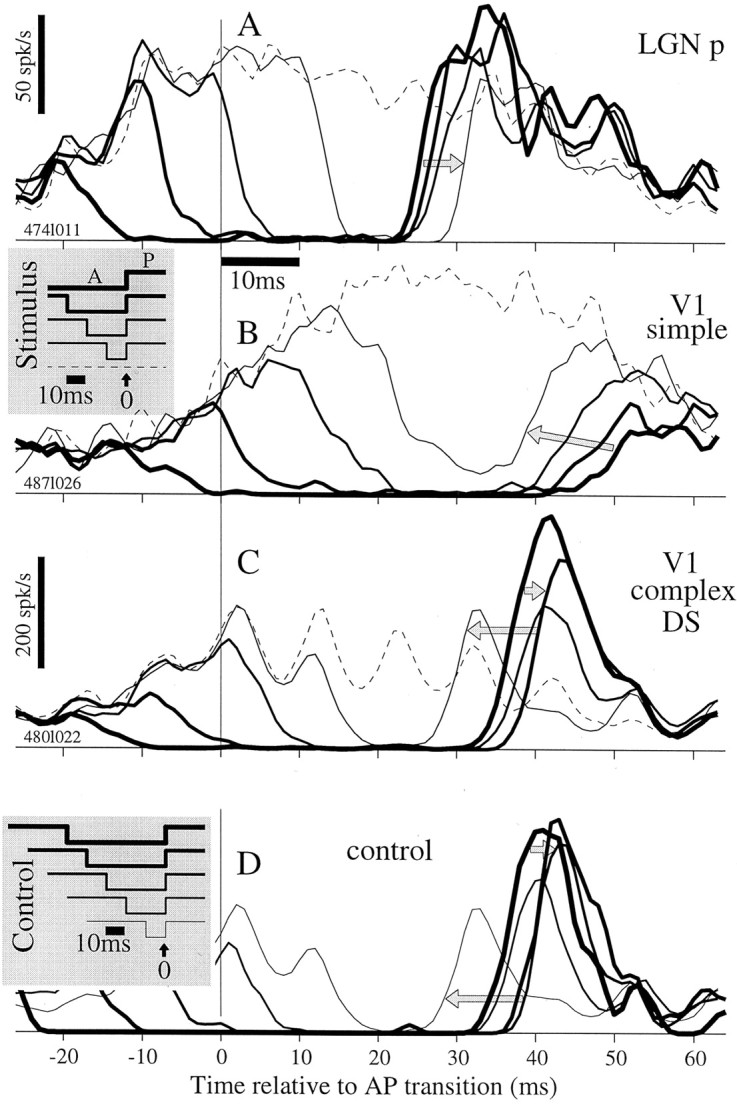
Fig. 10.

Latency depends on the duration of the antipreferred stimulus, and the dependency shows several trends across cell classes. A, LGN p-cell average responses for five stimulus sequences (see stimulus inset belowA) for counterphase stimulus. The response delay increased (gray arrow) as the antipreferred epoch was shortened. This trend occurred for all p- and m-cells. Responses include at least 250 occurrences for each pattern. B, Responses for this V1 simple cell to the counterphase stimulus showed a trend opposite to that for LGN: the response delay decreased (gray arrow) as the antipreferred epoch was shortened. This was representative of more than half of V1 cells, whereas others showed a trend similar to that in the LGN. Responses include at least 250 occurrences for each pattern. C, Responses for a V1 complex DS cell to the direction stimulus show a third trend: response latency first increased (shorter arrow) and then decreased as the antipreferred epoch was shortened (longer arrow). Responses include at least 188 occurrences for each pattern. This was typical of V1 complex DS cells and MT cells. D, Responses are shown for six stimuli (gray inset), which each have 30 msec of P before the A epoch. The fifth stimulus (thinnest line) is unchanged from the top panels. As TAshortens, the response to the AP transition first shifts rightward and then leftward, consistent with the behavior in C. Responses include 12, 24, 48, 94, and 192 occurrences for thethickest to thinnest lines, respectively.
