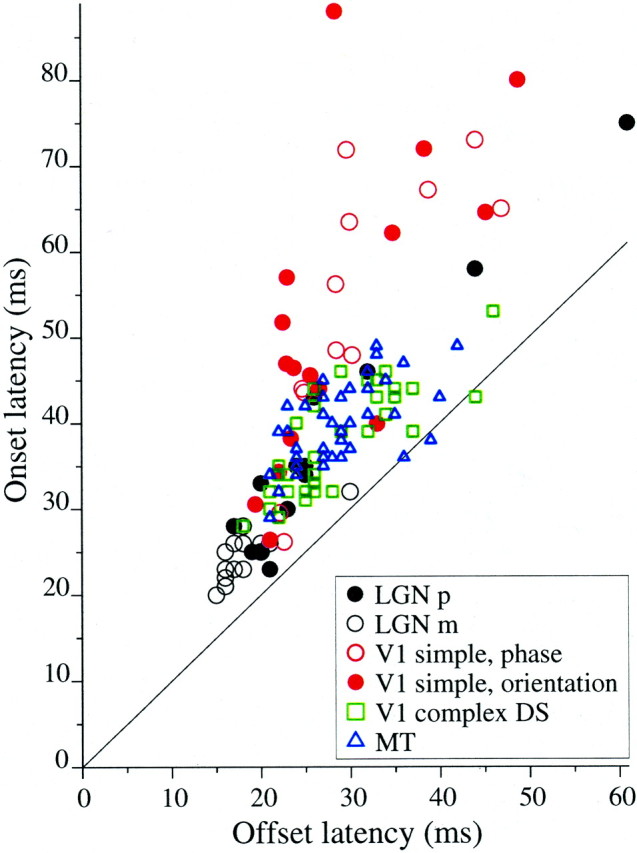
Fig. 3.

A comparison of onset and offset latencies across cell types and stimulus categories. The latency of the response to the transition from antipreferred to preferred (onset latency) is plotted against the latency of the response to the opposite stimulus transition (preferred to antipreferred, offset latency). Nearly all points fell above the diagonal line of equality, indicating that onset latency is longer than offset latency. The mean onset and offset latencies for each cell class and stimulus type are reported in Table 1.
