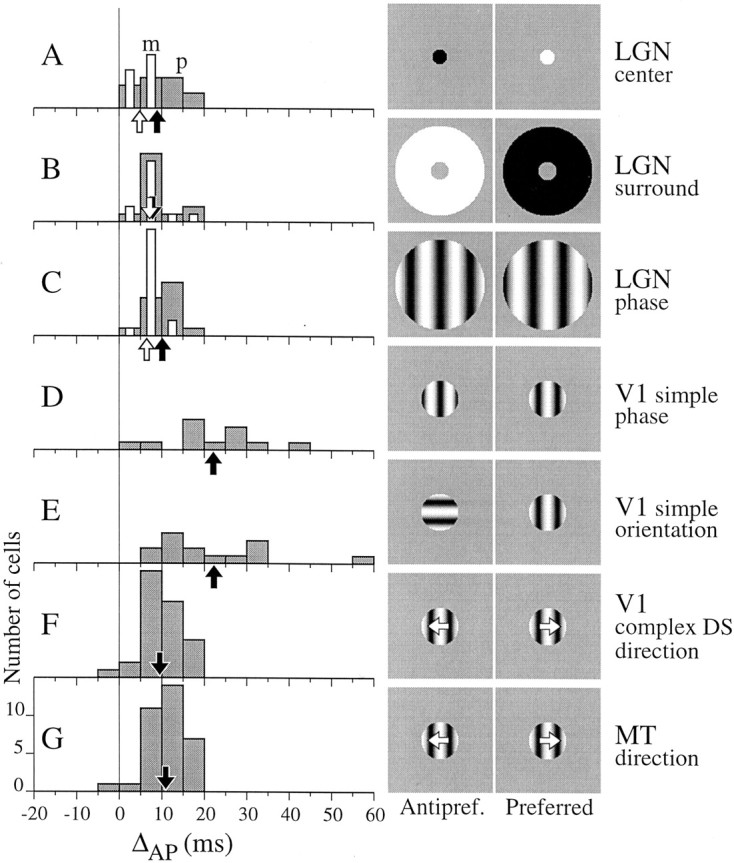
Fig. 4.

The distribution of the timing asymmetry, ΔAP, across cell types and stimulus categories.A, LGN p-cells (gray bars,n = 13) and m-cells (white bars,n = 12) had ΔAP > 0 when driven by a disk in the RF center. The mean for p-cells, 8.9 msec (black arrow), was significantly greater than that for m-cells, 4.8 msec (white arrow; t test,p = 0.017). B, When tested with an annulus in the RF surround, p- and m-cells had similar values of ΔAP (means, 7.8 and 7.2 msec, respectively).Arrows showing means overlap. C, For the phase stimulus, p-cells (n = 14) had a significantly larger ΔAP than m-cells (n = 17; means, 10.1 and 6.5 msec; ttest, p = 0.007). Black andwhite arrows show means for p- and m-cells, respectively. D, V1 simple cells tested with the phase stimulus had more varied and larger ΔAP values on average (mean, 22 msec; n = 12) than ΔAP for the LGN. E, The distribution of ΔAP for V1 cells tested with the orientation stimulus was similar (mean, 22 msec;n = 14) to that for the phase stimulus.F, V1 complex DS cells (n = 32) tested with the direction stimulus had on average a smaller (9.5 msec) and less scattered value of ΔAP than simple cells tested with static gratings. G, MT cells (n= 34) tested with the direction stimulus had a distribution of ΔAP similar to that for V1 complex DS cells (mean, 10.9 msec).
