
Fig. 6.
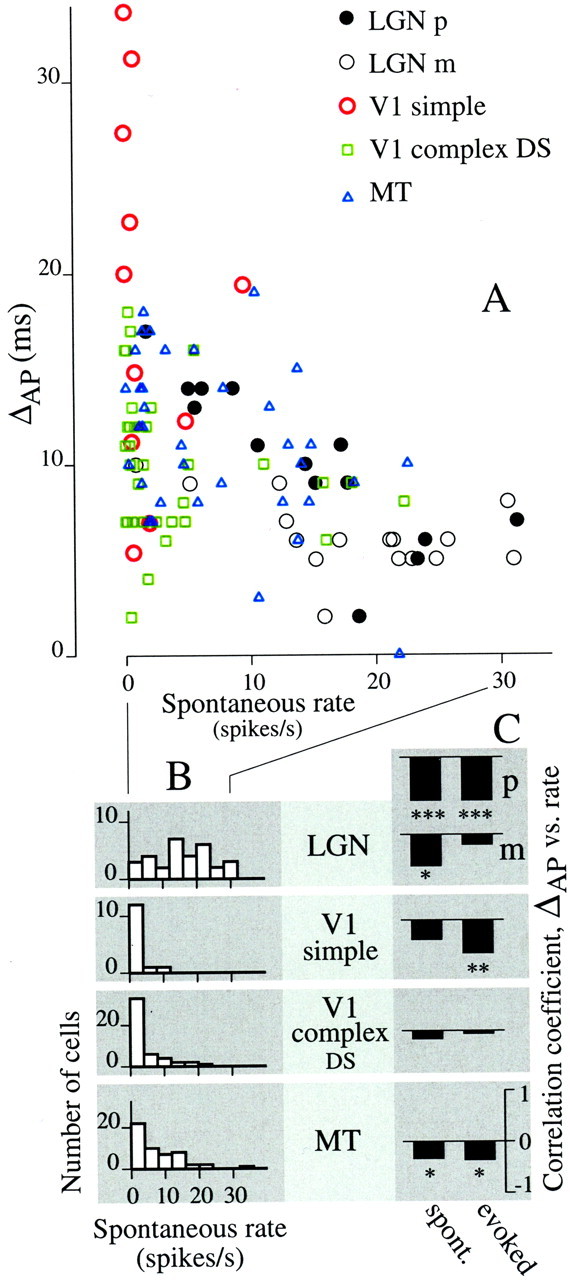
Firing rate is negatively correlated with ΔAP. A, For five classes of neurons, ΔAP is plotted as a function of spontaneous rate. LGN p- and m-cells and V1 simple cells were tested with the phase stimulus. V1 complex DS and MT cells were tested with the direction stimulus.B, The distribution of spontaneous rate varies across cell class. LGN p- and m-cell data were combined into one histogram because their distributions were statistically indistinguishable (t test for mean, p = 0.34;F test for variance, p = 0.89). LGN cells had high and varied spontaneous rates compared with cortical cells. C, Correlation coefficients computed between ΔAP and spontaneous rate (left column ofbars) and between ΔAP and evoked rate (right column) were always negative.Asterisks indicate statistical significance: *p < 0.05; **p < 0.01; ***p < 0.001. Evoked firing rate was computed in the 20 msec period after the onset of response to the AP transition.