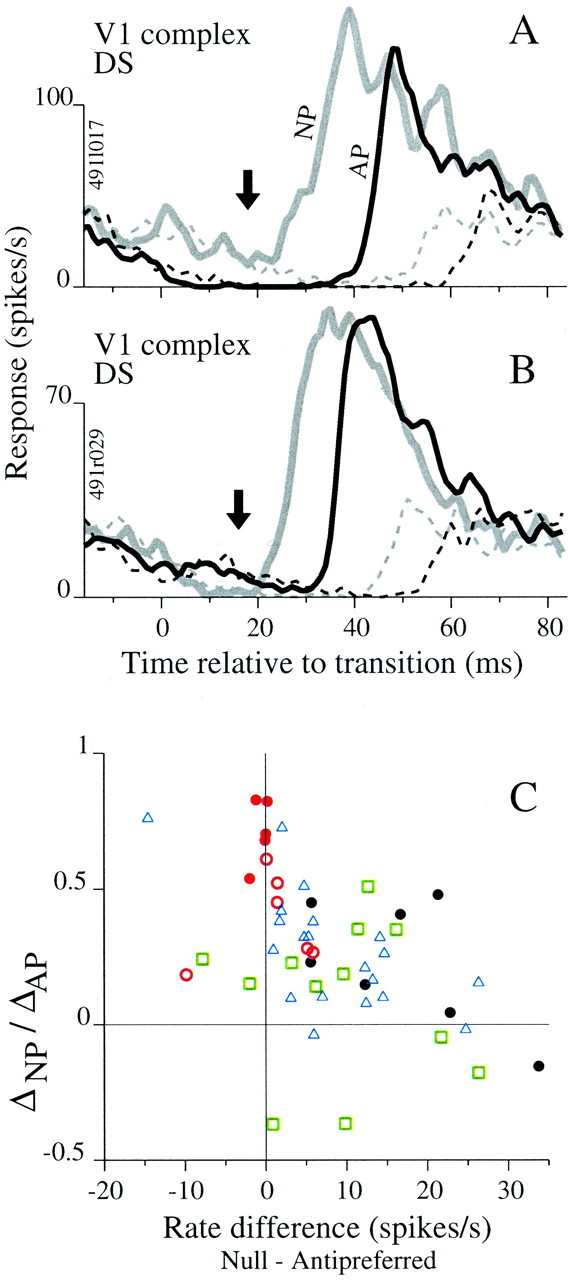
Fig. 8.

Comparing firing rates for antipreferred and null stimuli. A, Average responses for AP (black line) and NP (gray line) transitions and for reference stimuli (dashed lines of corresponding color; see Fig. 1A for stimulus timing). Before the response to the preferred stimulus, the rate associated with N (gray lines belowarrow) is higher than that associated with A (black lines below arrow). This trend held for 31 of 34 cells tested with the ternary, direction stimulus. Responses include at least 225 occurrences of each pattern.B, Format like A, but for one of three DS cells that had a higher firing rate before the AP response transition (black lines) than before the NP transition (gray lines). Responses include at least 450 occurrences of each pattern. C, The ratio ΔNP:ΔAP is plotted against the difference between null and antipreferred firing rates (calculated in the 10 msec epoch before the response to the transition) for LGN (filled circles), V1 simple cells (red circles) tested with phase (filled) and orientation (open) stimuli, V1 complex DS cells (green squares), and MT cells (blue triangles). There was a significant correlation across the combined data sets (r = −0.49;p = 0.0003; n = 50) and for the MT cells alone (r = −66; p = 0.001; n = 20). None of the V1 data sets had significant correlations by themselves. For the LGN,r = −0.60 (p = 0.15;n = 7).
