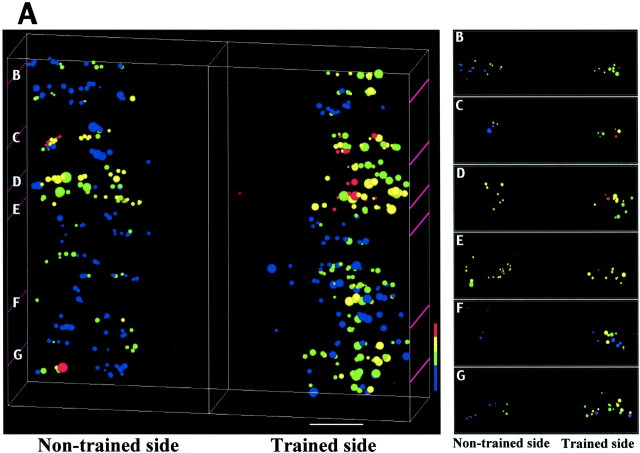
Fig. 5.
3-D reconstruction of GAD67immunoreactivity in spinal cord sections from cats trained to stand unilaterally. The distribution of GAD67-immunoreactive neurons was determined from 25 sequential cross sections (30-μm-thick) from the L6 and L7 spinal cord segments spanning ∼3 mm (A). Sections stained for GAD67were taken approximately every 120 μm. Individual GAD67-positive neurons in the ventral horn were captured at 500× at identical illumination. The area, the integrated optical density, and the corresponding x, y, andz positional information of these neurons were used to construct a 3-D image of GAD67 immunostaining. Six of 25 spinal cord sections arranged rostrocaudally are shown inB–G (top view). The level of each section is denoted in the 3-D figure in A (purple lines). The pseudocolor scale represents the labeling intensity of GAD67 immunostaining: 1.00–0.80, red; 0.79–0.60, yellow; 0.59–0.40, green; < 0.39, blue. The distributions of neurons (spanning 3 mm) across the intensity ranges were statistically different between trained and nontrained sides (p = 0.02, χ2 test; total number of neurons = 464). Scale bar, 500 μm.

