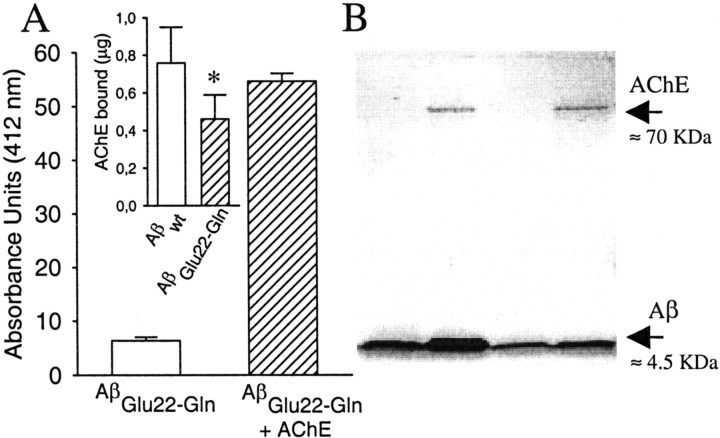
Fig. 3.
Presence of AChE in AβGlu22→Gln–AChE complexes. It was demonstrated by the hydrolysis of the substrate acetylthiocholine (A) following the method of Ellman et al. (1961). Briefly, aliquots of 3 μl of AβGlu22→Gln fibrils and AβGlu22→Gln–AChE complexes were incubated in triplicate with acetylthiocoline, and the reaction was stopped with tacrine. Absorbances were determined at 412 nm. In theinset in A, the amount of AChE bound to 10 μg of both amyloid fibril types is shown. The AChE bound to the complexes was calculated by densitometric scanning of the SDS-PAGE bands of AChE compared with known concentrations of AChE. Data are mean ± SEM (error bars) values of five to nine separate experiments. *p < 0.05 by nonpaired Student'st tests versus the respective values of Aβwt–AChE complexes. B shows an SDS-PAGE with samples from both types of fibrils and complexes used in the present work. The different lanes were occupied as follows: lane 1, purified Aβwt fibrils;lane 2, Aβwt–AChE complexes; lane 3, AβGlu22→Gln fibrils; and lane 4, AβGlu22→Gln–AChE complexes.

