Fig. 4.

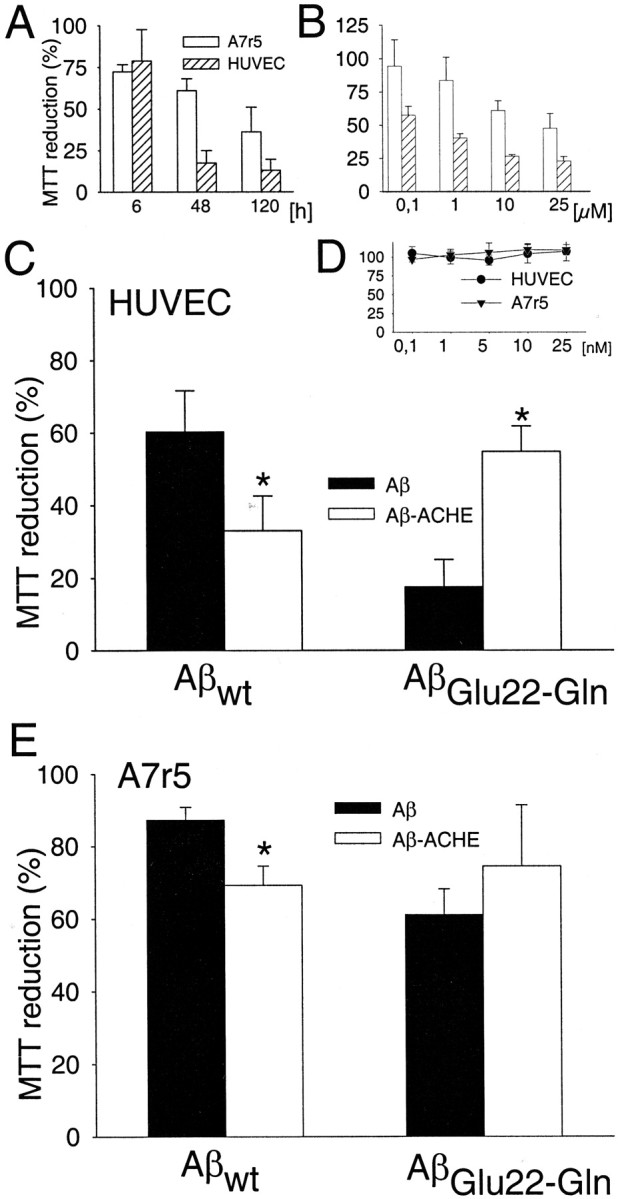
Cytotoxicity of Aβ fibrils and Aβ–AChE complexes on HUVEC (C) and A7r5 (E) cells are expressed as MTT reduction percentages obtained from the incubation with 10 μmfibrils alone (black bars) and complexes with AChE (white bars) for 48 hr. Data are mean ± SEM (error bars) values of five experiments performed in triplicate. *p < 0.05 by nonpaired Student's ttest versus the respective experiments performed with fibrils without AChE. A, MTT reduction percentages obtained with 10 μm AβGlu22→Gln fibrils at different incubation times. Data are mean ± SEM (error bars) values of three experiments performed in triplicate. B, MTT reduction percentages obtained after 48 hr of treatment with increasing concentrations of AβGlu22→Gln fibrils. Data are mean ± SEM (error bars) values of five to eight experiments performed in triplicate. D, MTT reduction percentages obtained by incubating A7r5 and HUVEC cells for 48 hr with increasing concentrations of AChE alone in the range that is bound to the fibrils. Data are mean ± SEM (error bars) values of three experiments performed in triplicate.
