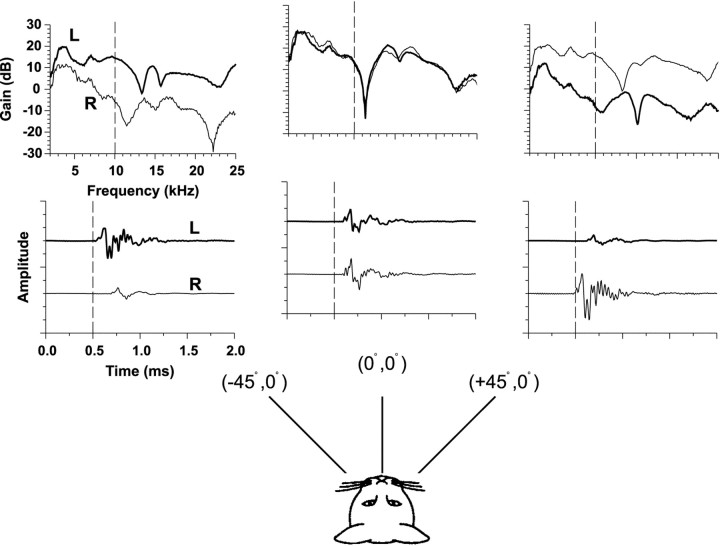
Fig. 1.
HRTFs (top) and associated time impulse responses (bottom) at the left (L) and right (R) ears of a cat to broadband clicks are shown for three positions on the horizontal plane. The HRTFs are plotted as gain relative to the response to the same click in the absence of the cat versus frequency. ITDs are captured in the relative differences in onset times of the time waveforms and ILDs by the relative differences in gain at the two ears as a function of frequency. The monaural spectral cues can be seen by the changes in spectral shape as a function of azimuth. These HRTF measurements are from one cat from the experiments of Musicant et al. (1990).

