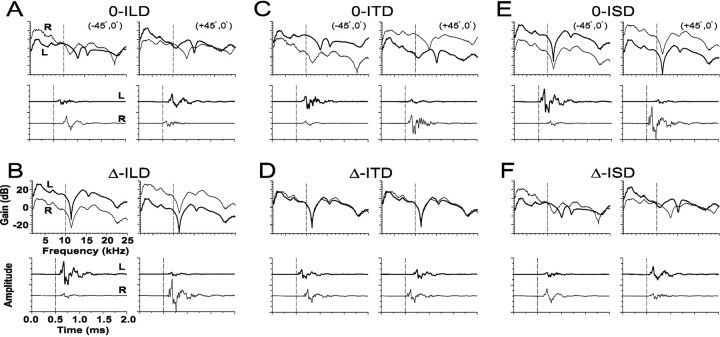
Fig. 2.
Examples of the six manipulations of the HRTFs used to independently vary (or hold constant) in azimuth each of the three primary localization cues in isolation while holding constant (or varying) the others. Each of the six panels shows the gains (top) and time waveforms (bottom) at two different azimuths (±45°). For the conditions in which the ITD, ILD, and spectral cues were held constant, they were set to the values corresponding to those at (0°, 0°). For the conditions in which ILD was manipulated, the ILD was calculated through a 1/3-octave Gaussian bandpass filter centered on the CF of the cell under study. A CF of 10 kHz was assumed for illustrative purposes and is indicated by adashed vertical line in each HRTF plot.A, 0-ILD: the amplitudes of the signals at the two ears were adjusted until the ILD was 0 dB for all azimuths, but the ITD and spectral cues varied naturally with azimuth. B, Δ-ILD: the spectra and ITD were held fixed, but the amplitudes of the time waveforms at each ear were adjusted so that the ILD as a function of azimuth was the same as in the natural condition as in Figure 1.C, 0-ITD: the relative onset times of the stimuli presented to the two ears were adjusted so that at each azimuth the ITD was 0 μsec, but the ILD and spectral cues varied naturally.D, Δ-ITD: ILD and spectral cues were held fixed, but onsets of the time waveforms were adjusted so that ITD varied naturally with azimuth. E, 0-ISD: spectral cues were held fixed, but the ILD and ITD cues varied naturally with azimuth.F, Δ-ISD: spectral cues varied naturally with azimuth, whereas ILD and ITD were held fixed.

