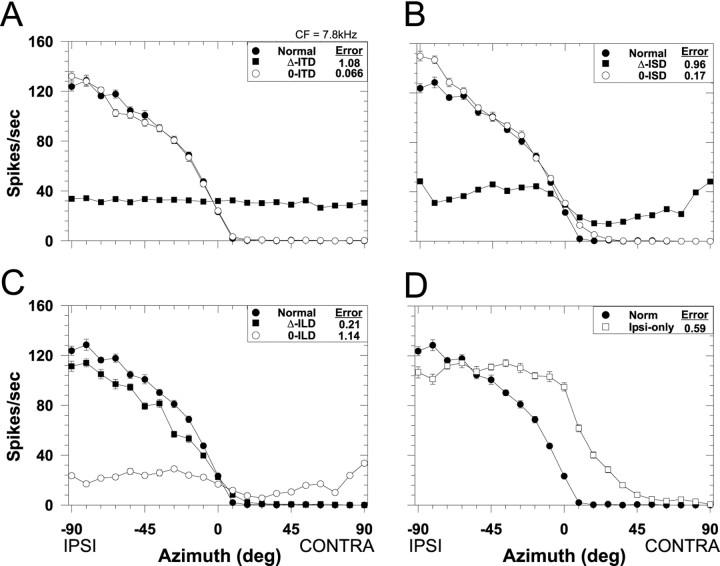
Fig. 3.
Spatial receptive fields in azimuth for one LSO cell (CF, 7.8 kHz) for both the normal stimulus condition in which all localization cues varied naturally with azimuth (filled circles) and for each of the seven cue manipulation conditions. Each data point plots the mean discharge rate of the cell averaged over the 200 msec duration of the noise stimuli and 20 presentations. Negative azimuths correspond to sounds in the ipsilateral field. Error bars plot ± SEM and when not present, the SEM is smaller than the height of the symbol. The RMS difference error (see Materials and Methods) for each cue manipulation is shown in the caption.A, ITD cue manipulations. B, Spectral cue (ISD) manipulations. C, ILD cue manipulations.D, Monaural ipsilateral-ear only spatial receptive field.

