
Fig. 8.
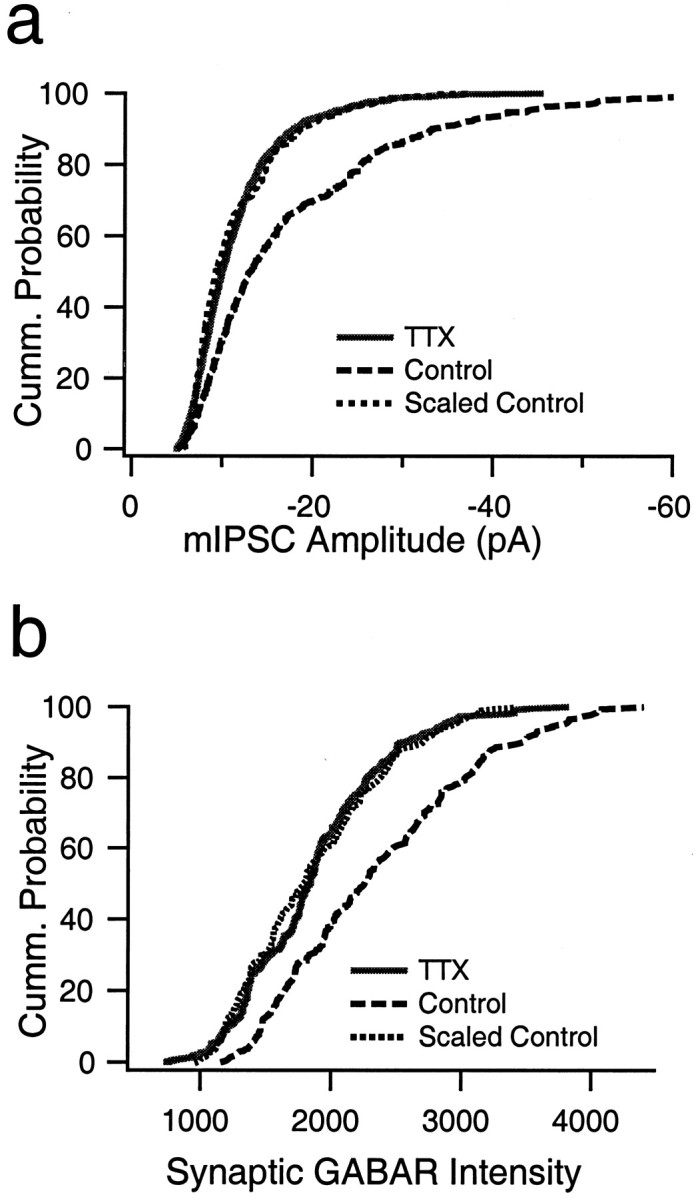
mIPSC amplitude and the fluorescent intensity of synaptic GABAAR labeling are both reduced in a multiplicative manner by activity blockade. a, Cumulative distribution of mIPSC amplitudes from nine control neurons (dashed line; 30 events per neuron) and nine neurons treated with TTX for 2 d before recording (solid line; 30 events per neuron). Scaling down the control distribution by a factor of 0.46 produced a good fit to the TTX-treated distribution. b, Cumulative distribution of the intensity measurements from synaptic GABAAR puncta from control (dashed line; 316 puncta) and neurons treated with TTX for 2 d before recording (solid line; 240 puncta). Scaling down the control distribution by a factor of 0.74 produced a good fit to the TTX-treated distribution.