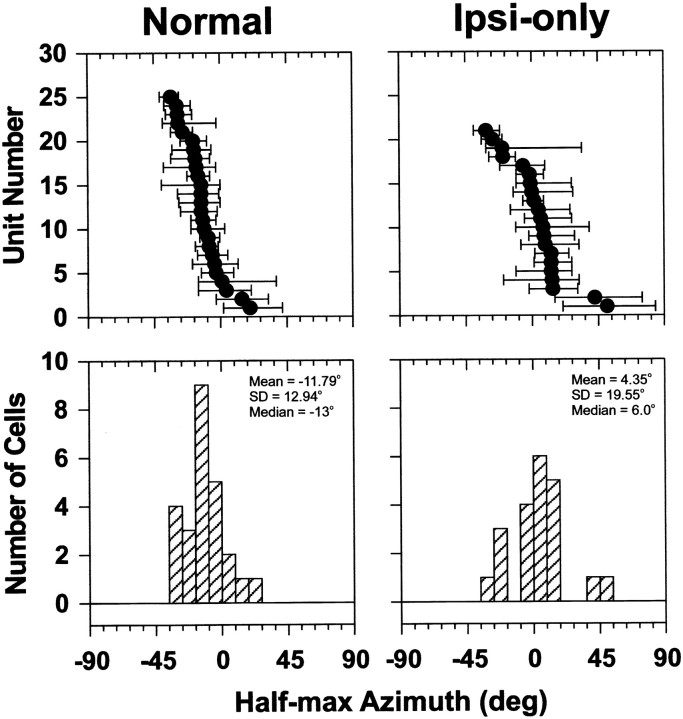
Fig. 6.
The top panels plot the distribution of half-maximal azimuths (filled circles) and the ranges of azimuth corresponding to 25–75% of maximum discharge (bars). Data for the normal and ipsi-only conditions are shown in the left andright columns, respectively. Note that the data for each cell is plotted as a function of increasing half-maximal azimuth toward the ipsilateral sound field for both the normal and ipsi-only configurations. As a result, the same cell number in each plot does not necessarily designate the same cell. The bottom panelsshow histograms of the normal and ipsi-only half-maximal azimuths. The normal binaural spatial receptive fields are located predominantly in the ipsilateral sound field, whereas the ipsi-only receptive fields are located more into the contralateral field.

