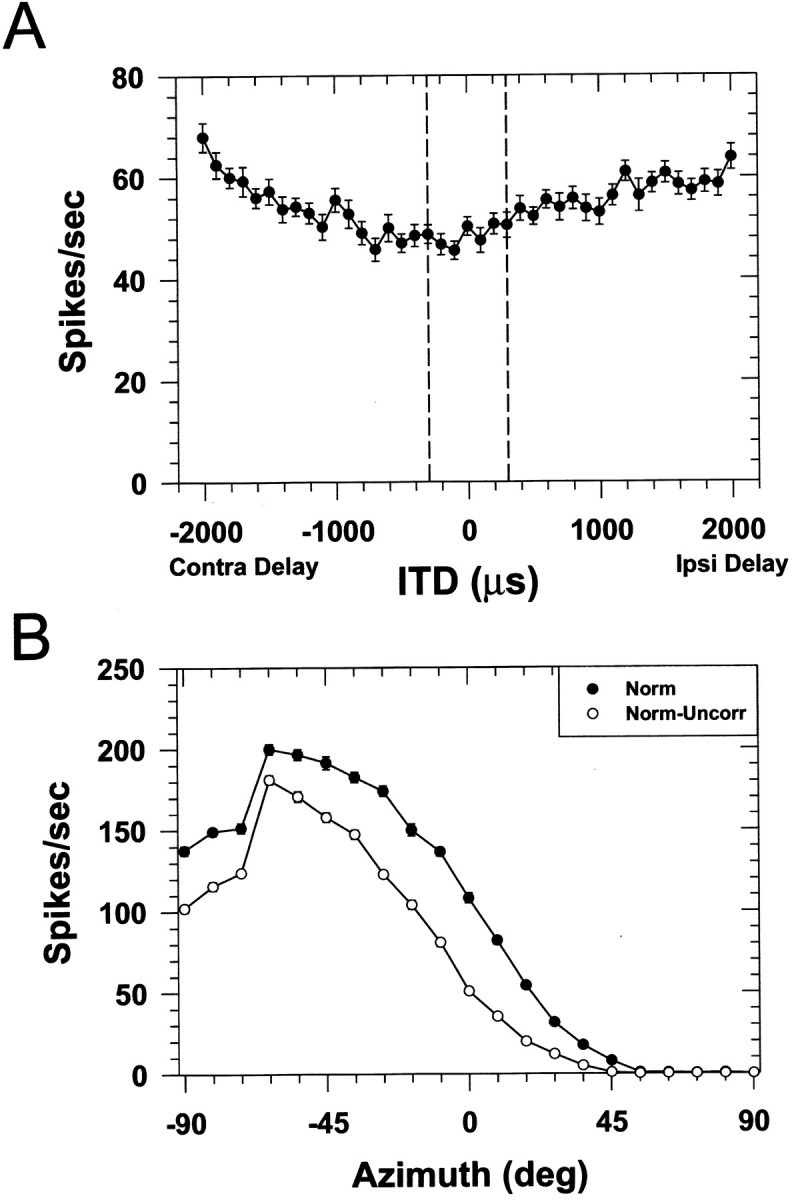
Fig. 8.

A, Responses of one LSO cell to broadband noise as a function of the interaural time difference. Data points plot the mean discharge rate ± 1 SEM. Negative delays indicate that the onset of the noise to the contralateral ear was delayed with respect to that at the ipsilateral ear. Thevertical dashed lines indicate the range of ITDs expected for the average adult cat. The response of the cell is not modulated by ongoing ITDs in broadband noise over this range of ITDs.B, Normal binaural SRFs of another LSO cell under conditions in which the broadband noises presented to the two ears were identical (filled circles) or uncorrelated (open circles).
