
Fig. 3.
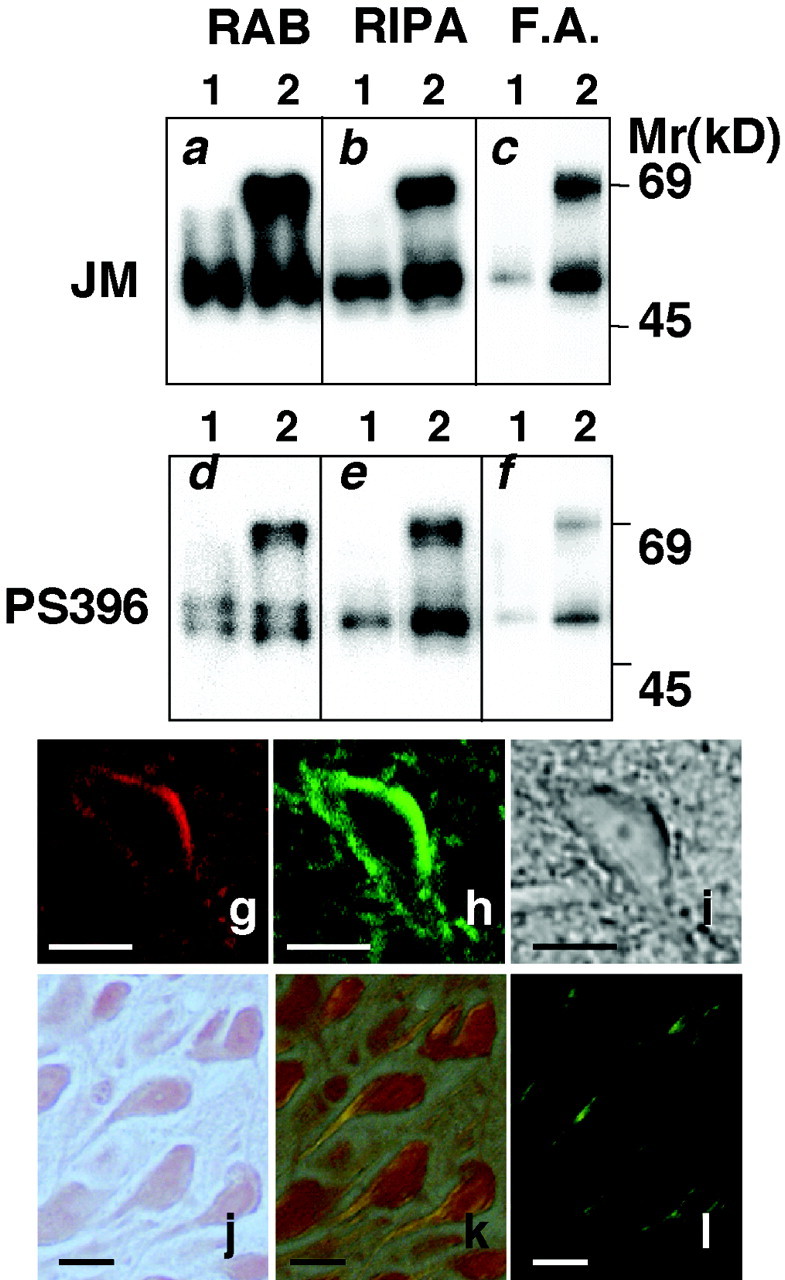
Biochemical analysis of tau from the hippocampus of Tg214 mice. Hippocampi from non-Tg littermates (lane 1), and Tg214 (lane 2) were used for analysis. The same amount of protein (20 μg/4 μl) collected in the RAB and RIPA fractions was pipetted into each well, and the same volume (4 μl) of samples collected in the FA fraction was used. Separated proteins were transferred to a membrane, incubated with either anti-tau antibody JM or phosphorylation-dependent anti-tau antibody PS396 as the primary antibody, and visualized by ECL. a,d, RAB fraction. b, e,RIPA fraction. c, f, FA fraction.g–l, Histological characterization of irregularly shaped neurons using Congo Red staining and double staining with Alz50 and thioflavin-S. g, Image of an Alz50-immunostained neuron. h, Image of the same neuron stained with thioflavin-S. i, Phase-contrast photomicrograph of the Alz50–thioflavin-S-stained neuron shown ing and h. j–l, Light photomicrographs of Congo Red-stained sections. Photomicrographs shown in j were photographed without a polarizing filter. Photomicrographs shown in k and l were photographed with a polarizing filter set at different angles. The irregularly shaped neurons showed Congo Red birefringent fibrils that appear orange (k) and apple green (l) in color. Scale bars, 10 μm.