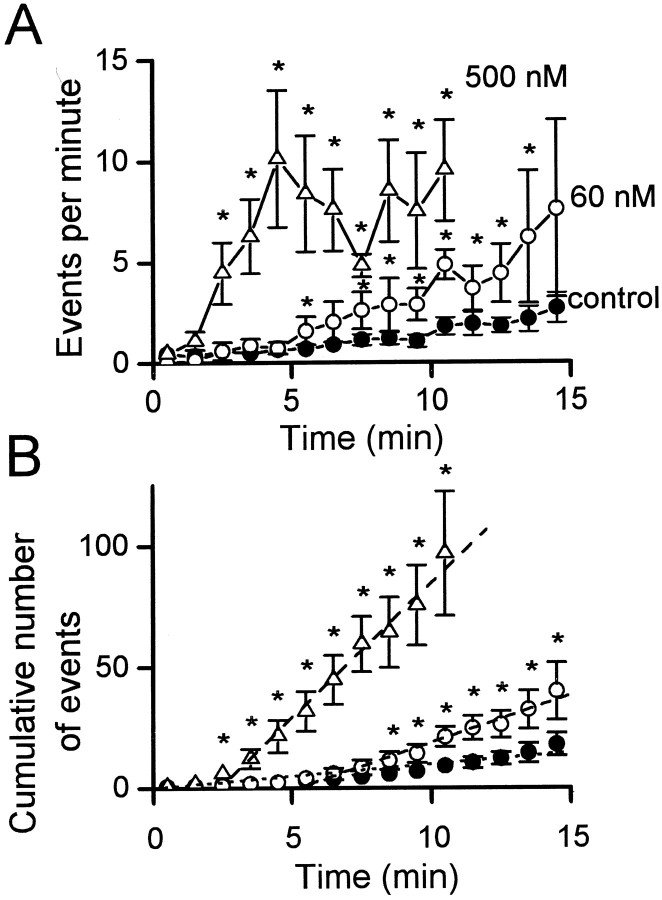
Fig. 2.
The effect of different concentrations of α-SNAP. A, Plot of the mean number of amperometric events per minute from individual cells dialyzed with control solution (●, n = 18–34), with 60 nm α-SNAP (○, n = 5–7), or with 500 nmα-SNAP (▵, n = 7–13). The time refers to the duration of whole-cell dialysis. [Ca2+]i was clamped near 170 nm by intracellular diffusion of Ca2+-buffer solution. The asterisksindicate the times when data points for α-SNAP are statistically different from controls. B, Plot of the data inA as the mean of the cumulative number of amperometric events from individual cells at different durations of whole-cell dialysis. The rate of exocytosis in control cells and cells recorded with α-SNAP was estimated from linear regression (lines shown). For control cells, all the data points were included (r = 0.98). For cells dialyzed with α-SNAP, each linear regression started at the time when the comparison with control cells became significantly different inA. For cells dialyzed with 60 mm α-SNAP, the linear regression included the data between the 6th and 15th minute of whole-cell dialysis (r = 0.98). For cells dialyzed with 500 nm α-SNAP, the linear regression included the data between the 3rd and 15th minute of whole-cell dialysis (r = 0.99).

