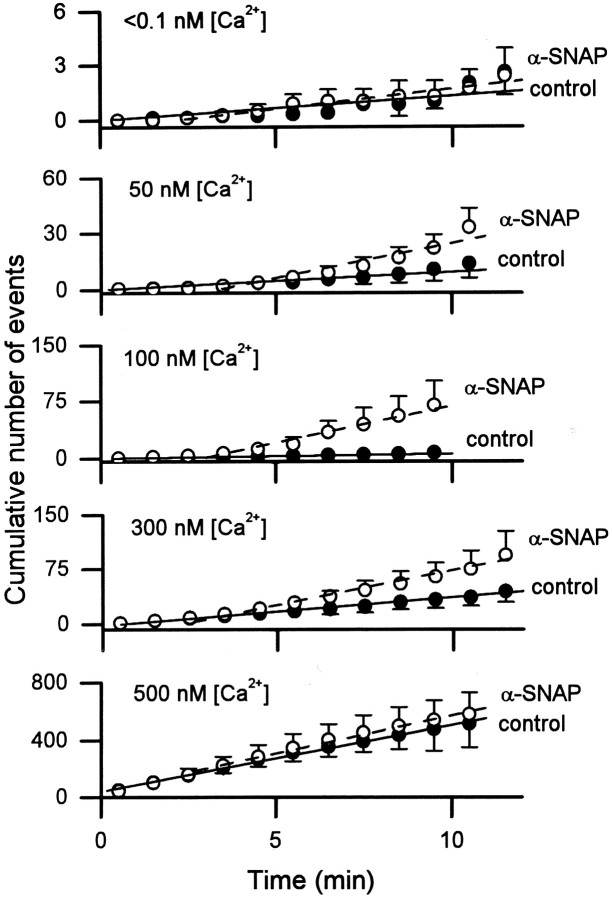
Fig. 3.
Plot of the mean cumulative number of amperometric events from individual cells after whole-cell dialysis with solutions buffered to different [Ca2+]i, with or without 500 nm α-SNAP. As in Figure 2B, the linear regression of control cells (filled symbols) included all data points; the linear regression for cells dialyzed with α-SNAP (open symbols) began at the third minute of whole-cell dialysis.

