Fig. 3.
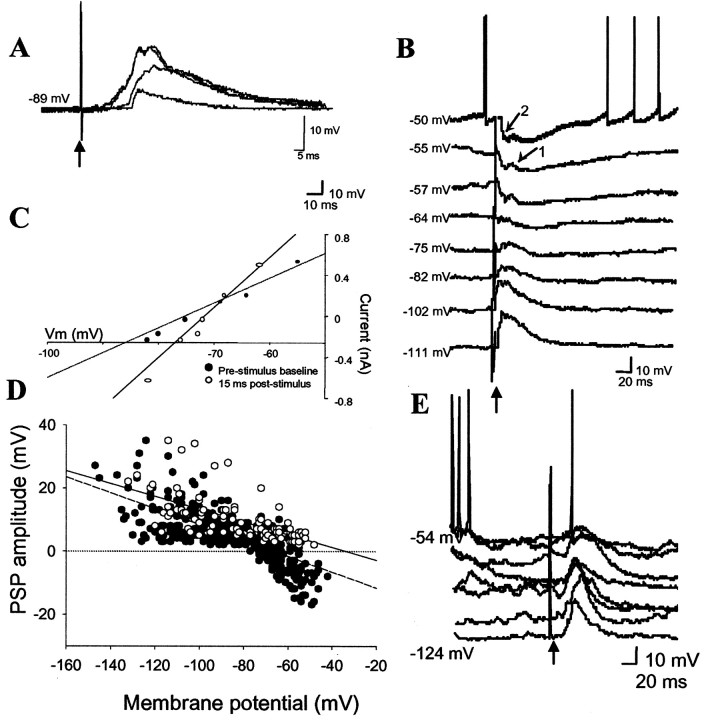
Response to mPFC stimulation.A, The PSP amplitudes evoked by mPFC stimulation are stimulus intensity-dependent. (Voltage traces of responses to 0.1, 0.4, and 0.7 mA of stimulation are displayed.) Intracellular voltage traces indicate that mPFC stimulation evokes PSPs that reverse close to the chloride reversal potential (B, arrow 2) and sometimes PSPs that are extrapolated to reverse near −30 mV (B, arrow 1).C, The reversal potential of the primary PSP evoked in the neuron in B, demonstrated by the intersection of baseline membrane potential (filled circles) and PSP amplitude (open circles) in a plot of PSP amplitude as a function of membrane potential, is −67 mV. The grouped data (n = 39) plot of the PSP amplitude by membrane potential (D) for the EPSPs (white circles) and the IPSPs (black circles) demonstrates that the IPSPs reverse near the chloride reversal potential (dashed line), whereas the EPSPs are extrapolated to reverse near −20 mV (solid line). In contrast, mPFC-evoked responses in striatal neurons do not reverse near the chloride reversal potential (E). Upward arrows indicate mPFC stimulation.

