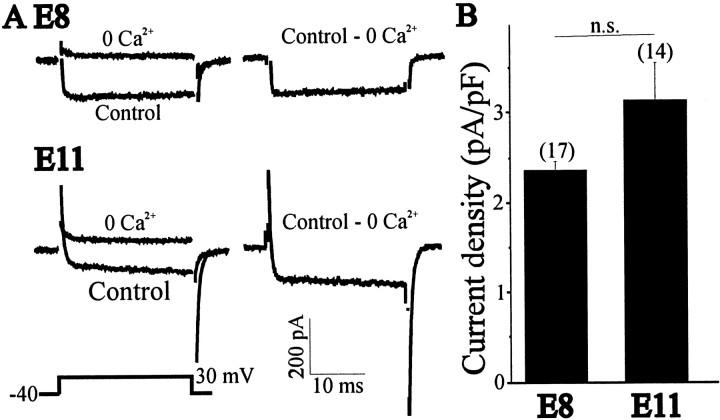
Fig. 6.
Voltage-activated Ca2+ currents in E8 and E11 LMNs. A, Representative current traces in control and Ca2+-free saline. Total Ca2+ currents were obtained by digital subtraction (control, Ca2+-free), with representative examples shown on the right. Currents were evoked after a 250 msec step to +30 mV from a holding potential of −40 mV (left, bottom trace). B, Data compiled from many cells indicate no change in mean Ca2+ current density between E8 and E11.

