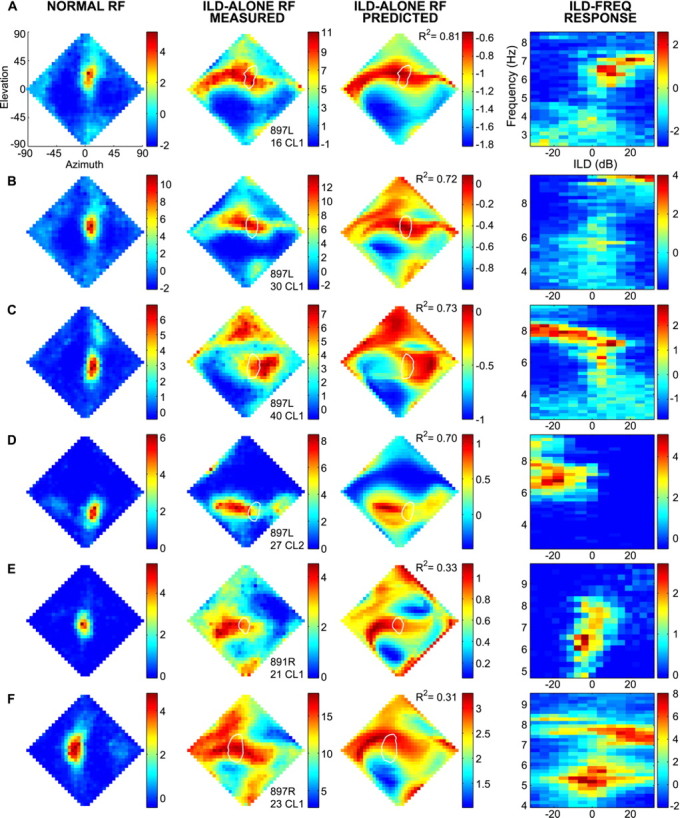
Fig. 3.

Contribution of ILD to spatial RFs. Rows A–F show the data from six single cells. Thediamond-shaped plots represent loci in the frontal hemisphere, from the owl's perspective, expressed in double-polar coordinates (Knudsen, 1982). Firing rates are represented in pseudocolor. Columns 1 and 2 show the normal RF and the ILD-alone RF, respectively. Column 3represents the ILD-alone RF predicted from the ILD-frequency response surface of that cell (column 4). The white loop on the diamond-shaped plots incolumns 2 and 3 depict the half-height contour line surrounding the normal RF of each cell. The scale bars forcolumns 1, 2, and 4indicate firing rate, in spikes per 100 msec stimulus, less the spontaneous rate. The scale bars for column 3 indicate the averaged sum of pure-tone responses, as described in Materials and Methods.
