Fig. 7.
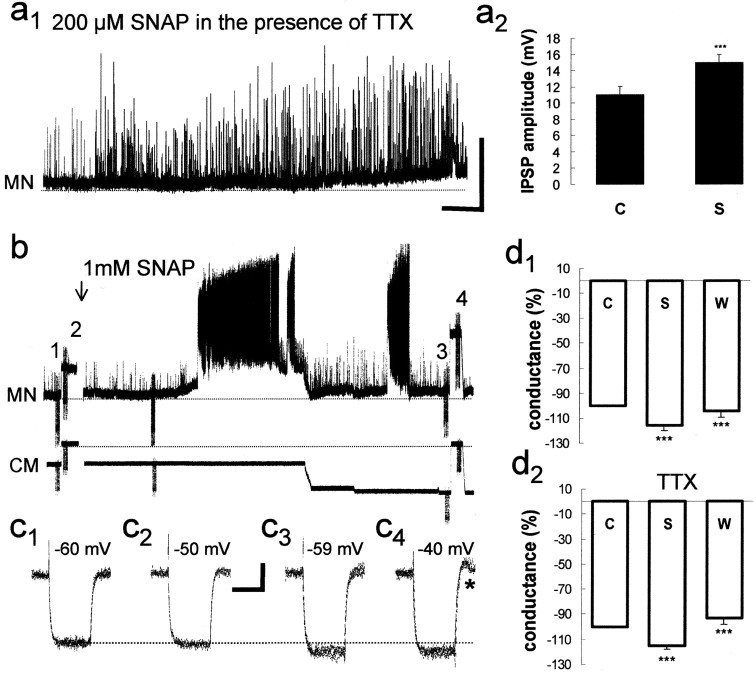
NO elicits a membrane potential depolarization and a conductance decrease, which persists in the presence of TTX. a1, In the presence of 100 nm TTX, the spontaneous increase in IPSP frequency and amplitude elicited by SNAP is apparent as the membrane begins to depolarize. a2, This is further quantified as a bar graph constructed from IPSP amplitudes measured within 30 continuous seconds in this experiment. As such, there were more data points in the SNAP condition, so the Mann–WhitneyU test was used to determine significance. ***p < 0.05. Calibration: 20 mV, 30 sec.b, A recording from a motor neuron (MN) in the absence of TTX on a slower time base also illustrates the membrane depolarization elicited by bath application of 1 mm SNAP. Note the episodes of spontaneous swimming activity and the increased occurrence of IPSPs during interepisode periods in the presence of SNAP, which increase in amplitude when the membrane potential is returned to control values after tonic hyperpolarizing current injection. CM, Current monitor. Trains of five superimposed 100 msec hyperpolarizing conductance test pulses under control saline with (c1) and without (c2) a 0.1 nA negative holding current show no detectable change in membrane conductance, despite a 10 mV difference in membrane potential. After the application of 1 mm SNAP, the membrane potential depolarizes and a pronounced decrease in membrane conductance is observed (c3, c4) that appears to be independent of membrane potential (compare values inc1 andc3). Differing levels of membrane potential are aligned for ease of comparison (dotted line). Note that at depolarized levels, a small rebound potential can occur (asterisk). This was also observed at similar membrane potentials in control conditions and therefore is unlikely to reflect a SNAP effect. Calibrations: b, 10 mV, 30 sec, 0.1 nA; c, 5 mV, 80 msec.d1, SNAP produced a significant (***p < 0.05) decrease in membrane conductance, which persisted in the presence of 100 nm TTX (d2). The bar graphs of the pooled data (± SEM) from 10 experiments in the absence of TTX and 4 experiments in the presence of TTX illustrate that SNAP reversibly decreased conductance and are expressed as percentage differences from control values. C, Control; S, SNAP;W, wash.

