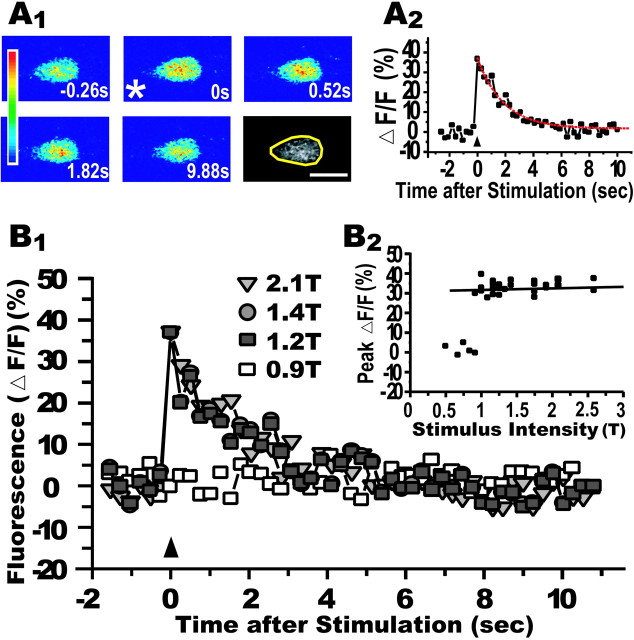
Fig. 2.
Fluorescence increase elicited in M-cell by antidromic stimulation. A1, Transient fluorescence increase was observed after an electrical shock was applied to the spinal cord (asterisk). The time (seconds) before and after the stimulus is denoted in each frame. The color scale on the left represents fluorescence intensity (blue, lowest; red, highest). Scale bar, 20 μm. A2, The fluorescence intensity of somata, the yellow region of interest of the last panel in A1, exhibited an abrupt increase and slow decay with a time constant of 1.8 sec (red dotted line, single-exponential fit). Increase in fluorescence (ΔF) was normalized by the resting level (F). B1, Transient fluorescence changes in a M-cell induced by several different intensities of spinal cord shock (arrowhead) were superimposed. The stimulus strength was expressed as a fraction of the M-cell firing threshold (T). B2, Relationship between peak fluorescence increase (ΔF/F;y-axis) and stimulus intensity (x-axis) in the M-cell as exemplified in B1. The fluorescence increase induced by suprathreshold stimulus (<2.5T) was constant (solid line represents a linear regression line). Thus, the Ca2+ response appeared in an all-or-none manner, like antidromic M-cell spike generation.

