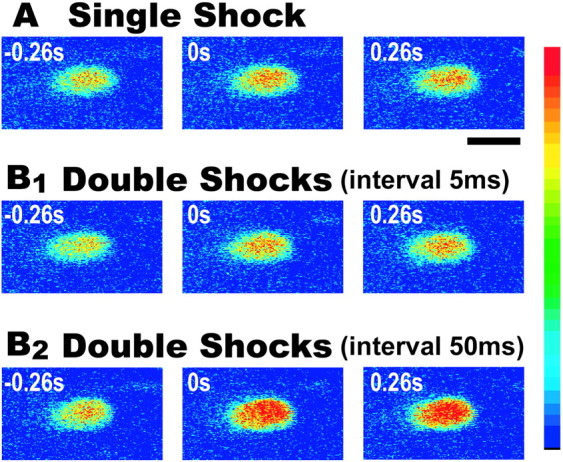
Fig. 5.

Ca2+ elevation in an M-cell in response to single (A) or double (B1, B2) AD shocks. The time (seconds) before and after the stimulus is denoted in each frame. Thecolor scale on the right is the same as in Figure 2. A single shock (A) and double AD shocks with a 5 msec interval (B1) produced similar levels of Ca2+ increase. In contrast, the double shocks with a 50 msec interval evoked a much larger Ca2+ increase. Scale bar, 20 μm.
