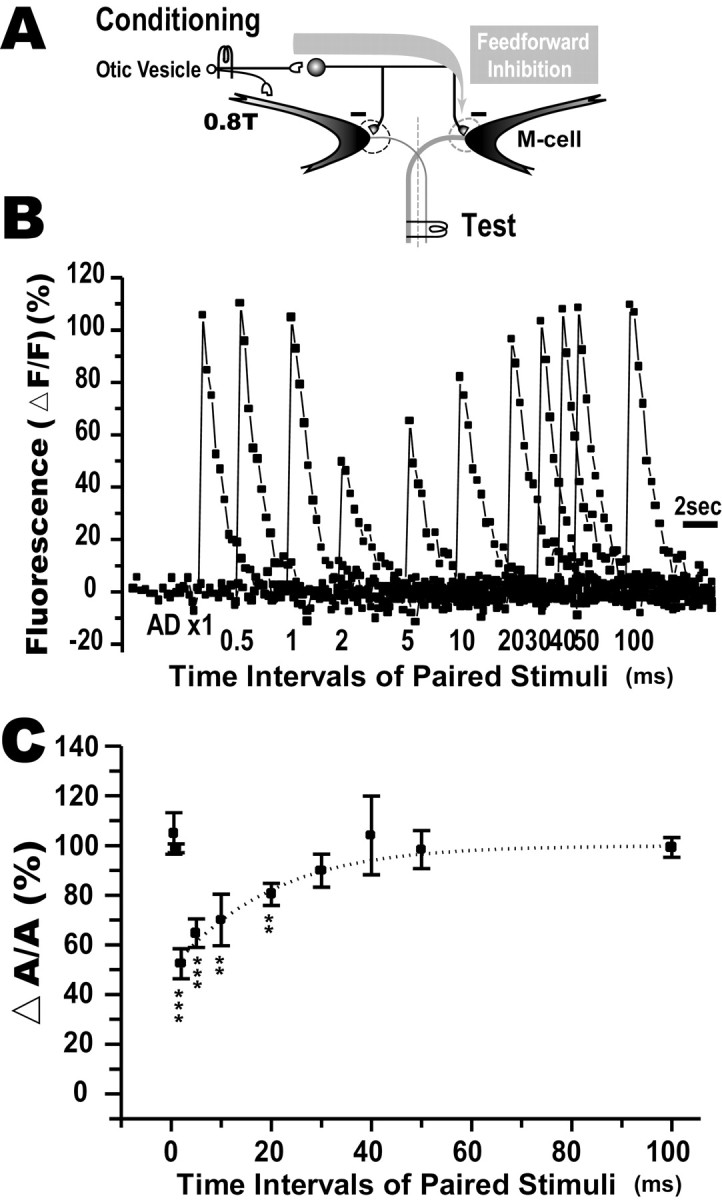
Fig. 9.

Feedforward inhibition from eighth nerve afferents to the contralateral M-cell. A, An otic vesicle was electrically stimulated with subthreshold intensity (0.8T) for the ipsilateral M-cell. B, Superimposed Ca2+ responses evoked in an M-cell by pairing the afferent and AD stimuli at intervals denoted below. The Ca2+ response was maximally reduced when the two stimuli were paired at a 2 msec interval. AD ×1, Ca2+ response to the AD stimulus alone.C, Relationship between normalized amplitude of the paired response (ΔA/A,y-axis) and intervals of the paired stimuli (x-axis), summarized from five fish. ΔA/A at intervals of 2–20 msec were significantly reduced from control (***p < 0.0005; **p < 0.002, t test). Thedotted line expresses the Boltzmann fit to the data points from 2 to 100 msec. The half-recovery time was 15.0 ± 2.6 msec (n = 5). The time course of the feedforward inhibitory shunt matches that obtained in a previous electrophysiological study (cf. Oda et al., 1998).
