Fig. 5.
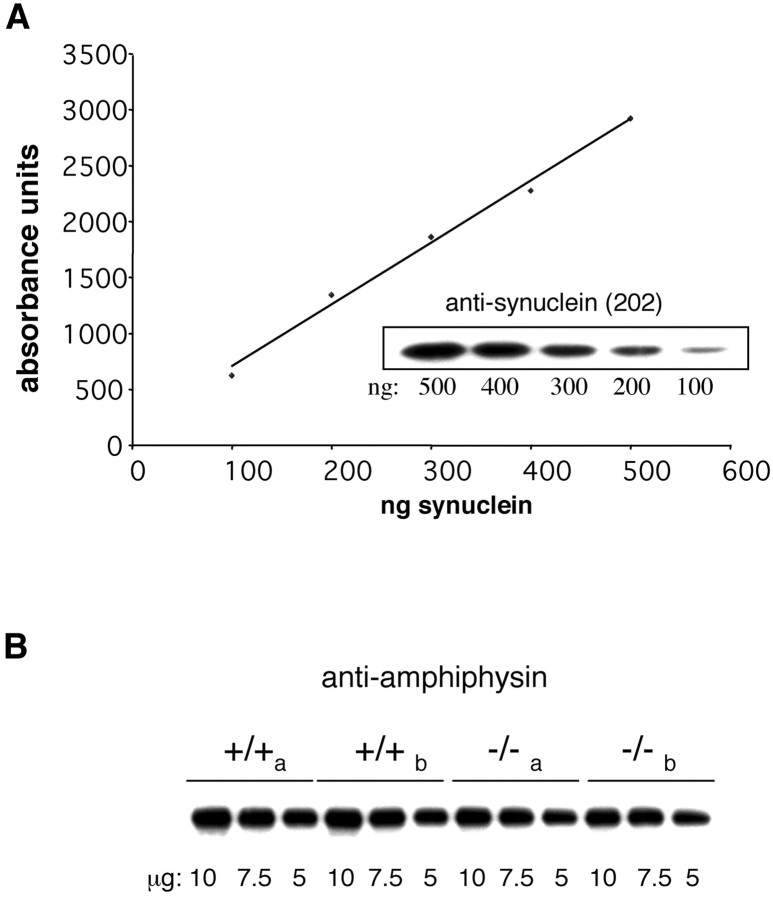
Quantitative immunoblot analysis of synaptosomes from control and Snca−/− mice.A, Known amounts of recombinant α-synuclein (100–500 ng) were separated by SDS-PAGE and subjected to immunoblot analysis with the anti-synuclein antibody 202 (inset). Detection was with HRP-labeled secondary antibodies and development by enhanced chemiluminescence. A standard curve of band intensity versus the amount of protein generates a linear curve. B, A representative example of the immunoblot intensity data used to generate the ratios in Table 1. Dilutions of synaptosome fractions purified from two brains from independent (a, b)Snca+/+ mice and two independent (a, b) Snca−/− mice were analyzed on each blot to control for intergel variability and were immunoblotted with anti-amphiphysin antibody.

