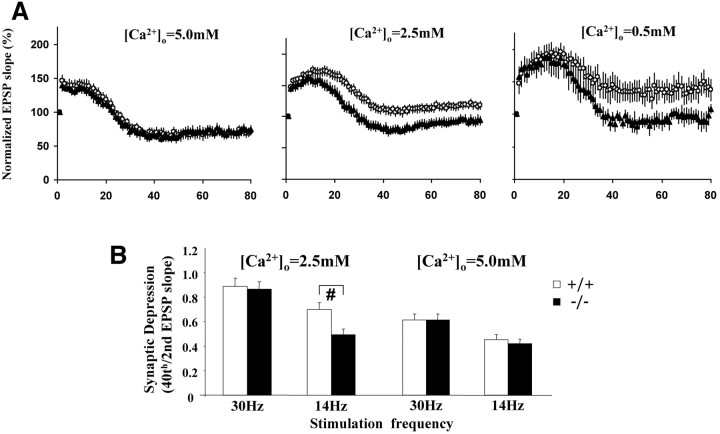
Fig. 8.
Relationship between α-synuclein and Ca2+ in synaptic responses to PRS. Synaptic depression was induced at CA1 synapses by PRS (14 Hz) in the presence of the NMDA antagonist dl-APV (100 μm). A, Effect of [Ca2+]o on synaptic depression. The slopes of field EPSPs during the entire recording were normalized to the first EPSP slope in each recording. The mean EPSP slopes are plotted against the number of stimuli (1st to 80th pulses) at low (0.5 mm), normal (2.5 mm), and high (5.0 mm) [Ca2+]o, inSnca+/+ (n = 9, 22, and 9) and Snca−/−(n = 6, 17, and 9) synapses, respectively.B, Effect of stimulation frequency on synaptic depression. Synaptic depression was induced by PRS and was expressed as the ratio of the 40th and 2nd EPSP slopes. The same slices were used for both 14 and 30 Hz PRS experiments. White columns, Data obtained in normal (2.5 mm) [Ca2+]o inSnca+/+ (n = 13) and Snca−/− (n = 14) slices. Black columns, Data obtained in high (5 mm) [Ca2+]o inSnca+/+ (n = 14) and Snca−/− (n = 16) slices.

