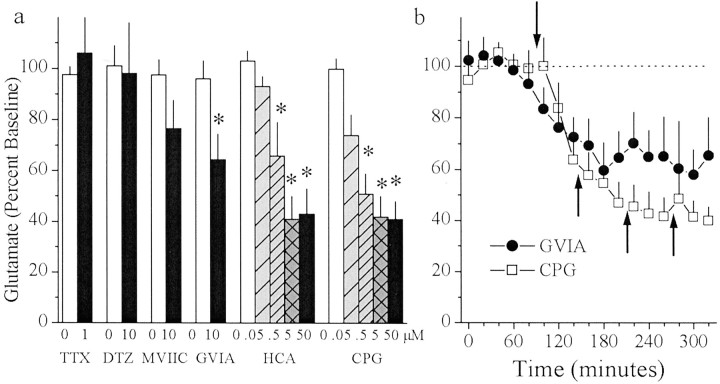
Fig. 1.
In vivo microdialysis was used to sample extrasynaptic glutamate in the striatum before and after reverse dialysis of the Na+-channel blocker TTX (n = 9), the L-type Ca2+ channel blocker diltiazem (n = 7), the P/Q-type Ca2+ channel blocker MVIIC (n = 6), the N-type Ca2+ channel blocker GVIA (n = 8), or the cystine–glutamate antiporter inhibitors HCA (n = 6) and CPG (n = 7). a, Data are presented as mean (± SEM) glutamate (percentage of baseline levels) from samples collected during baseline (100 min) or at each drug concentration (60 min/concentration). b, Data from a are presented as glutamate across 20 min samples for rats receiving GVIA (0 or 10 μm) or CPG (0, 0.05, 0.5, 5.0, and 50 μm). The downward pointing arrow indicates the beginning of the infusion of GVIA or CPG. Upward pointing arrows indicate increases in CPG concentration as described ina. A one-way ANOVA on glutamate levels indicated a significant effect of drug concentration for GVIA (F(1,5) = 6.75; p< 0.05), HCA (F(4,20) = 10.19;p < 0.05), and CPG (F(4,24) = 18.64; p< 0.05). *p < 0.05, compared with baseline levels difference from baseline (Fisher's LSD post hocanalysis).

