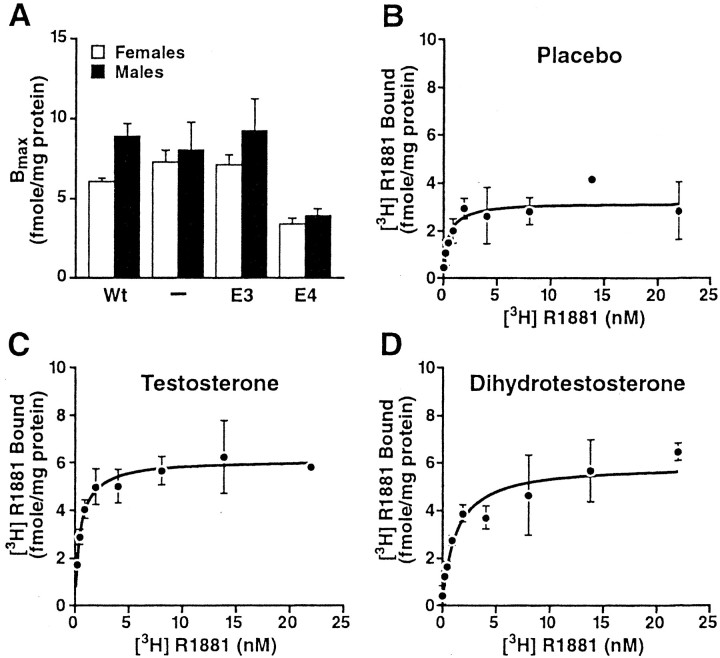
Fig. 4.
Cytosolic AR levels in the neocortex and response to androgen treatment. Total cytosolic AR levels were determined from AR saturation curves using a single curve-fit analysis. Results are expressed as femtomoles of [3H]R1881 bound per milligram of protein. There were no differences inKd among the groups (data not shown).A, Untreated male and female NSE–apoE4 mice had lower cytosolic AR levels than untreated NSE–apoE3,Apoe−/−, and wild-type (Wt) mice (n = 3–7 mice per gender and genotype). B–D, Effect of placebo (B), testosterone (C), and dihydrotestosterone (D) on AR saturation curves in female NSE–apoE4 mice (n = 3–6 mice per treatment).

