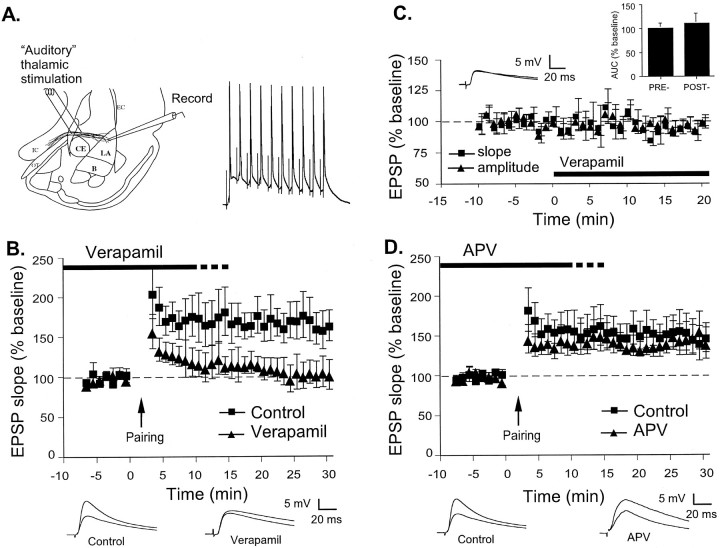
Fig. 1.
Pairing-induced LTP at thalamic input synapses in the LA is L-type VGCC dependent and NMDAR independent.A, Left, Schematic of the amygdala slice preparation, showing placement of stimulating and recording electrodes. Afferent fibers from the auditory thalamus enter the LA medially, coursing through the ventral most part of the striatum just above the central nucleus. Recordings were made just below the site of termination of auditory thalamic fibers terminating in the LA.CE, Central nucleus of amygdala; B, basal nucleus of amygdala; IC, internal capsule;OT, optic tract; EC, external capsule.Right, Example of the response of one cell to 10 stimuli delivered at 30 Hz paired with 1 nA, 5 msec depolarizations. This pairing was given 15 times at 10 sec intervals to induce LTP.B, Mean ± SE percentage of EPSP slope (relative to baseline) in cells treated with ACSF vehicle (n = 6; squares) or 50 μm verapamil (n = 5; triangles) before and after LTP induction by pairing at time 0. Traces (averages of 10 responses) from individual experiments before and 30 min after LTP induction are shown below. C, Mean ± SE percentage of EPSP slope (n = 5; squares) and amplitude (n = 4; triangles) relative to baseline before and after treatment with 50 μm verapamil at time 0. Traces (averages of 10 responses) are taken from an individual experiment before and 20 min after verapamil application. Inset, Mean ± SE integral under evoked EPSP (AUC) relative to baseline before and 20 min after verapamil application (n = 5).D, Mean ± SE percentage of EPSP slope (relative to baseline) in cells treated with ACSF vehicle (n = 8; squares) or 50 μm APV (n = 8; triangles) before and after LTP induction by pairing at time 0. Traces (averages of 10 responses) from individual experiments before and 30 min after LTP induction are shown below.

