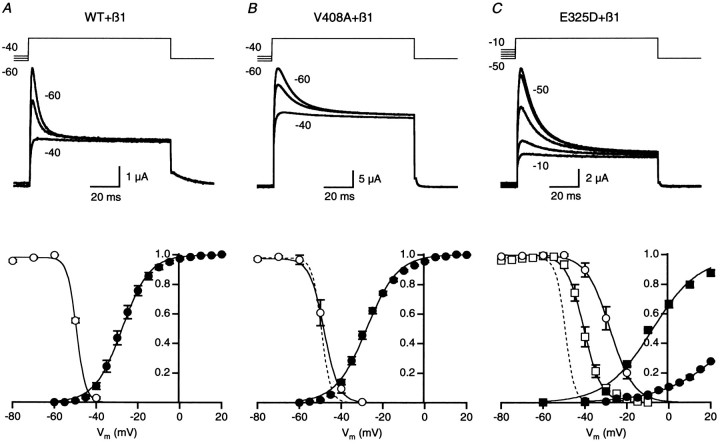
Fig. 2.
Voltage dependence of availability for WT, V408A, and E325D channels coexpressed with hKvβ1. A, Current traces, recorded from oocytes expressing WT and hKvβ1 subunits, evoked by a depolarizing pulse to 40 mV from a 1 sec prepulse potential of −60, −50, and −40 mV. The voltage template is shown in thetop traces. The peak current measured relative to steady-state inactivation was normalized by the maximum value and plotted versus the prepulse potential; mean ± SEM data are displayed as open circles in the bottom graph (n = 26). A Boltzmann relationship was fit to the data, yielding a V1/2 of −49.5 mV and slope factor of 2.7 mV. The voltage dependence of activation was determined in separate experiments without hKvβ1 subunit coexpression. Tail currents were measured at −50 mV after a test pulse to potentials between −60 and 40 mV, and the peak outward tail current was plotted versus test pulse potential. The data for each oocyte was normalized to the maximum current averaged over several pulses at the plateau of the voltage relationship. The data from several oocytes were averaged (filled circles;n = 7) and fit with a Boltzmann relationship, yielding a V1/2 of −27.6 mV and a slope factor of 6.5 mV. B, Current traces recorded from oocytes expressing V408A and hKvβ1 subunits. Dashed line represents WT availability curve from A.C, Current traces recorded from oocytes expressing homomeric E325D (open and filled circlesfor inactivation and activation, respectively) or heteromeric WT-E325D (open and filled squares for inactivation and activation, respectively) and hKvβ1 subunits. Dashed line represents WT availability curve fromA.

