
Fig. 6.
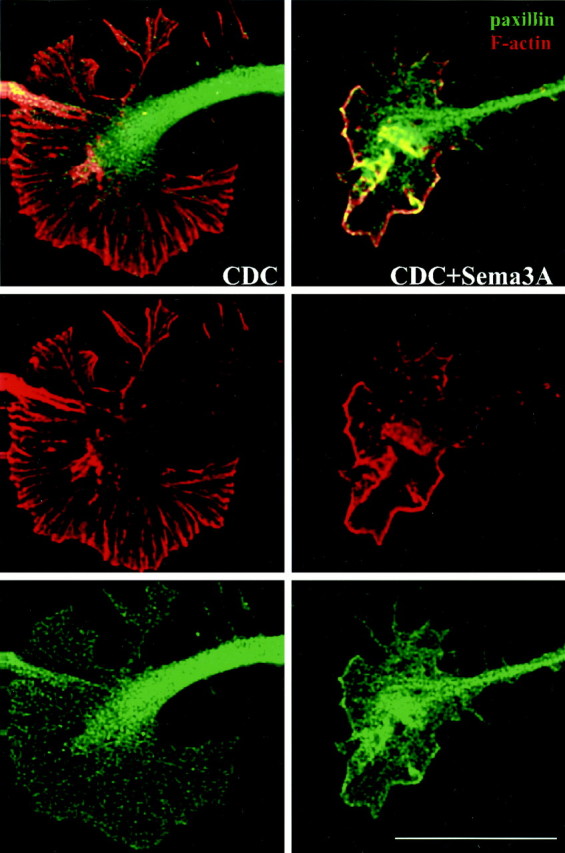
Effects of CDC and Sema3A on growth cone F-actin and paxillin as shown by confocal microscopy. Images are optical sections through the attachment area. DRG growth cones were pretreated with 10 μm CDC for 45 min before challenge (7.5 min) with control medium or Sema3A (∼0.5 nm). Collapse effects paralleled those reported in Figure3. F-actin is shown in red, paxillin is shown ingreen, and areas of overlap appearyellow. From top tobottom, panels show merged images, F-actin only, and paxillin only. Scale bar, 15 μm.