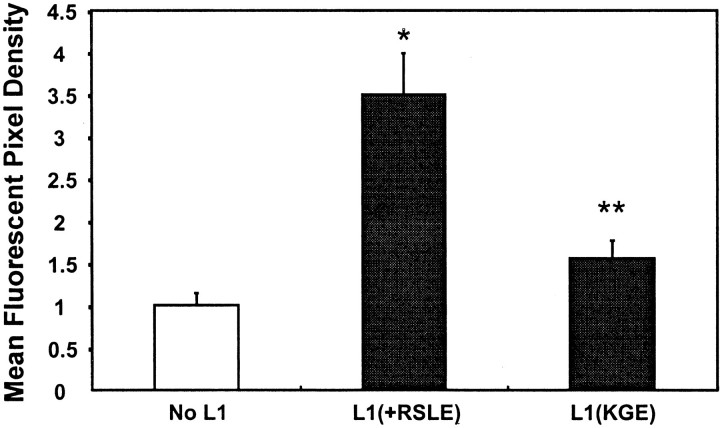
Fig. 10.
Mean fluorescent pixel density of internalized β1 integrin in confocal micrographs from experiments of Figure 9. After 5 min at 37°C there was a statistically significant increase in internalized β1 integrins in L1(+RSLE)-HEK293 cells compared with HEK293 cells not expressing L1 (∗) and a decrease in internalized β1 integrins in L1(KGE)-expressing cells compared with L1(+RSLE)-HEK293 cells (**) by the t test (one-tailed;p < 0.05).

