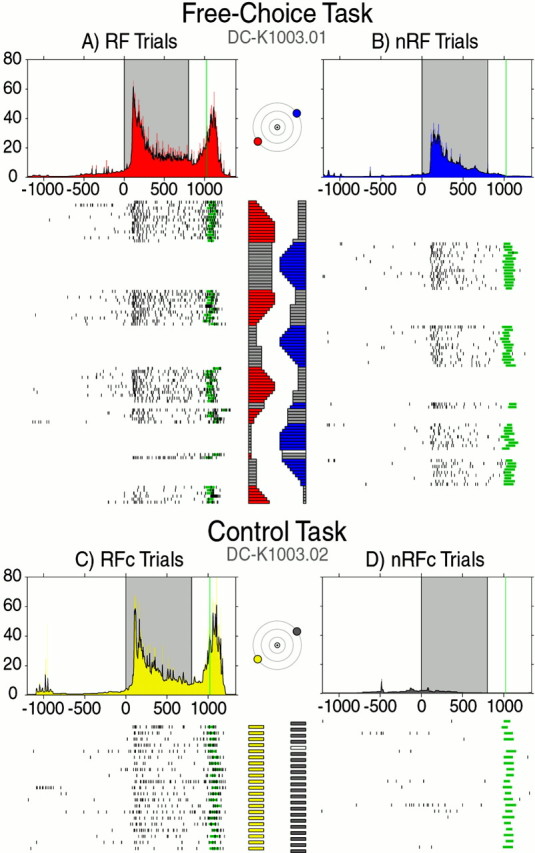
Fig. 3.

Visual and motor responses of a typical cell in the right FEF during the FC task (top) and the control task (bottom). Plots are arranged by task and destination of saccade. For both tasks, the activities are shown separately for both kinds of trials where a saccade was made either to the target in the RF (RF target; left-down, 30°) or to the target outside the RF (nRF target; right-up, 30°). Rasters are in chronological order from top to bottom.Black ticks indicate neuronal spikes, and green bars indicate saccade onset and duration. One millisecond 1/ISI functions are directly above the rasters they represent and are color coded to match the target plots for each task. The 5 msec condensed 1/ISI, or 1/ISI plots, for each are overlaid in black. The shaded area in each plot indicates the visual period (0–800 msec), and the green line represents the mean saccade onset. The horizontal bar plots next to each raster indicate the percentage of reward for each trial. Colored sections represent the percentage of reward given for a saccade to the corresponding target. For the FC task, dark gray bars indicate amount of reward the monkey voluntarily skipped, and white bars indicate error trials in both tasks.
